

Government Spend, Economic Growth, Deficits and Inflation in India: An Analysis of Aggregates
India is a low-middle income country, with nearly 2/3rd of its population living in rural areas. It is a young country too, with median age being less than 30 years. Given its size and the stage of development, it needs a large amount of investment in physical, economic and social infrastructure. India also has one of the largest population of poor people in the world. The government is not only a significant driver of economic activity, it also provides economic and financial support to under-provided and disadvantaged communities and regions through various schemes and programmes.
In this paper, we intend to study the consistency of aggregate government spend, given the impact of uncertainty caused by adverse external and natural conditions.[1] The adverse internal and external events include the Asian financial crisis (1997), dot-com bubble burst (2001), global financial crisis (2007) and the frequent droughts (2002, 2004, 2009, 2014 and 2015)[2].
We bring a long-term perspective to our analysis by covering the post-liberalisation period. It is about 25 years ago, during the early 90s, that India embarked upon building a market-based economic system. During this period, the country has grown at a much faster rate than any time earlier. At the same time, we do have people expressing concerns about the impact of these policy choices on equity of opportunity, distribution of income and wealth and on quality of life for a majority of people in India.
The economic policy pursued by the political parties, who have governed India during the period under study, has been similar. There has, of course, been a difference in emphasis and the approach in some situations. We will highlight these aspects wherever relevant, but the objective of our analysis is apolitical.
We expect the government resource allocation and economic and social policy choices to be consistent with each other and the context in which India lives and also help enhance India’s capability to grow, take and manage risk and deal with uncertainty.
The present article covers the analysis of aggregate expenditure and evaluates the impact of changes in expenditure level on deficits, inflation and growth, given the policy context.
How much has the government (State and Central) spent, how has it varied and has the expenditure level changed in response to changes in the context?
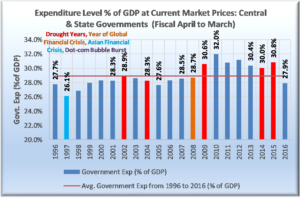
The state and the central governments have spent, on an average, an amount equivalent to 28.94% of the GDP (measured at current market prices) on development and the non-development expenditure, making them the biggest spender in the economy. While it was the lowest level at 26.1% during 1997, it reached a peak of 32.0% of GDP during 2010. Since reaching its peak, the expenditure level has fallen to 27.9% during 2016. It is interesting to note that the expenditure (% of GDP) during 2016 is just marginally higher than what it was during 1996. Given the GDP level in 2016, a one percent decrease in government expenditure implies a reduction in spending of about USD 20 billion.
In response to a drought, the government did raise the expenditure level during 2010 and 2015 (years immediately following the drought years) but followed it by a reduction during the immediately following year.
We have had 2 consecutive years of drought during 2014 and 2015. While the government expenditure level did go up during 2015 by 0.8%, it was followed by a decline of 2.9% during 2016 – a decline of nearly USD 58 billion at 2016 GDP level.
We would ask the following question in this context:
- Is it sufficient to raise the expenditure during the year of drought or do we need to invest consistently over a longer period for building the capability to deal with the next drought situation or any situations that cause high degree of uncertainty?[3]
- Are there any constraints that don’t allow the government to invest consistently when required?
A similar situation of two negative-impact events (global financial crisis and drought) was met by an opposite response – a 3.3% increase in the level of expenditure during 2009 and 2010 versus a marginal increase in 2015 and a significant decline during 2016. (Chart 1). The obvious question, therefore, is – why did the government behave differently under similar circumstances, i.e., situations where the country was faced with a serious distress situation?
Chart 1
Why does the government cut spending? Does the government spend not help?
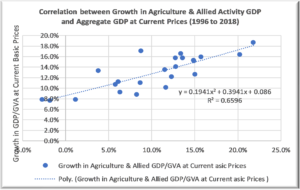
The question, therefore, is why would a government, in a largely agriculture dependent country, reduce its spend or not increase it sufficiently even during or after a drought year? The choice of reduction in expenditure after two consecutive years of drought during 2014 and 2015 is even more intriguing!!! Some economists/analysts have been making an argument that India has transitioned from being an agriculture dependent economy and therefore it can grow without agriculture being supported by the government. Let us look at the validity of that argument by estimating the correlation between growth in agricultural GDP and the aggregate GDP, both at current basic prices (Chart 2). We would argue that the correlation level of 0.6596 is sufficiently high to deserve further investigation to determine the impact of investment in agriculture on economic growth and the government’s role in this investment, particularly during the drought years.[4]
Chart 2
An argument for cutting back on government expenditure, often put forth by the believers of ‘minimum government’ premise, is the fear of inflation following or in anticipation of high fiscal deficit (or expenditure gap). Let us now examine if there is indeed a strong case for worrying about inflation.
Does the government spend or deficit cause inflation?
As a first step, we review the relationship between inflation and growth in government expenditure. Chart 3 below estimates the correlation to be relatively weak at 0.2264, which increases to 0.2836, if we exclude an exceptional year like 2016 – exceptional in the sense that the growth in government expenditure was negative at -0.1% and the inflation was at 5.6%.
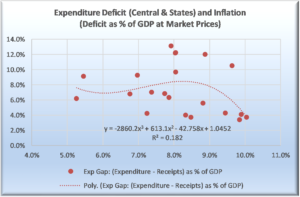
We also evaluate the relationship between expenditure gap or deficit (Receipts – Expenditure) and inflation to see if the level of deficit has much to do with inflation. Chart 4 below does not suggest that either. In fact, we observe that in many years, the inflation rate has been low even when the deficit rates are high, e.g., 2000 to 2004. Also, we have years when deficit is declining but inflation is increasing, e.g., 2004 to 2009. Similarly, Chart 5 below also suggests that the relationship between the level of deficit and inflation is at best moderate – a correlation of 0.182.
Chart 3
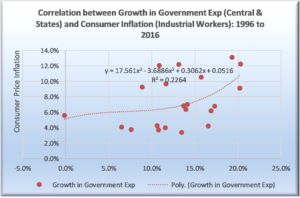
Chart 4
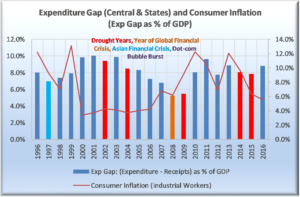
Chart 5
Does government expenditure contribute to economic growth?
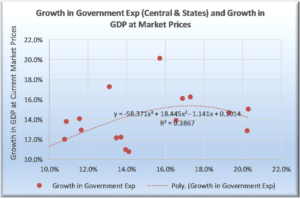
While we will discuss this issue in greater detail once we start working on resource allocation choices and their impact on economic growth, the aggregate analysis does suggest a relatively higher correlation between government expenditure and economic growth (Chart 6). It does not come as a surprise, as the government expenditure has been about 29% of GDP for the last two decades and the government is the single biggest spender in the economy. If we exclude a couple of exceptional years from our analysis, the relationship between government expenditure and growth strengthens even further.
In other words, the government expenditure does have a positive impact in driving growth in economic activity. We see the government playing an even more important role in enhancing the country’s ability to take risk and deal with uncertainty.[5] It has no reason to shy away, as the impact of higher expenditure or deficit on inflation is at best tenuous.
Chart 6
What causes inflation, if the government deficits don’t?
Given the stage of development, India is expected to have higher inflation. During the last two decades, it has been in double digits for 5 years (of the 20-year study period) and above the average rate of 7.1% for 3 years, making it 8 years of higher than average inflation (Chart 7). It may be noted that 5 of these 8 years (of above average inflation) have been between 2009 and 2014.
It may be pointed out here that the first decade of this century was characterised by exceptionally high commodity prices, including that of crude. Chart 8 below provides information about global commodity prices since 1995. Exceptionally high inflation is not really deficit led but is probably caused by unprecedented increase in global commodity prices. Commodity price inflation continued even after the global financial crisis – crisis that had led to a near collapse of demand for commodities and that of economic activity itself.
That is, we were living in a world where the growth rates were slowing down (or collapsing) but the commodity prices were going up. Commodity prices did collapse during 2008 but came back with a vengeance post that.
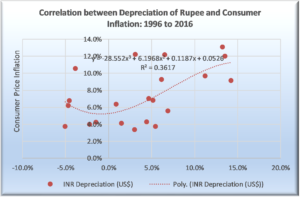
Another factor that impacts inflation and/or volatility in prices is the currency prices, particularly so in an economy that runs a large trade or current account deficit unless, of course, it has a large capital surplus (i.e., the country is an attractive investment destination). India runs very large trade deficit and a higher current account deficit in most years and has been an attractive destination in some years. Chart 9 below provides information about variation in exchange rates India and its relationship with inflation. And, it is not surprising to find a positive correlation between variation of in exchange rates and inflation as India has been becoming increasingly dependent on imports for feeding its consumption and investment growth.
Chart 7
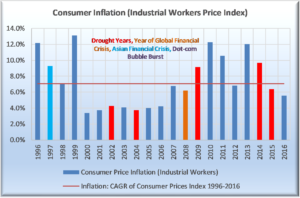
Chart 8
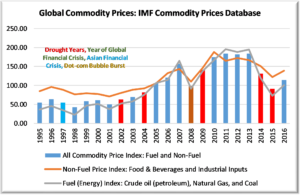
Chart 9
What caused the spike and peaking of Government Expenditure during 2009 and 2010?
The obvious explanation lies in spiking of commodity prices, global financial crisis and the drought. The global commodity prices increased by 43.3% and 24.2% during 2009 and 2010, respectively. The rain-deficit was at 21.8%, one of the worst rain-deficits in independent India. The government responded by raising its spends by over 20% for each of the two years. It not only increased the development expenditure, it also increased the subsidies on petroleum and food products – nearly doubling them from INR 709.26 billion (1.42% of GDP) in 2008 to INR 1,413.51 billion (2.18% of GDP) during 2010 (Chart 10). Another factor that added complexity was the surge in gold prices and the quantity of gold imports, putting pressure on exchange rate and resulting in speculative investment in an unproductive asset – all of that in a low middle-income country that needs large investment in basic infrastructure and has a large population of the poor (Chart 11). Subsidies as well as the gold imports have come down since then but continue to be high.[6]
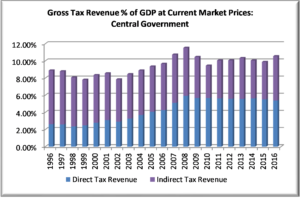
In addition, the government provided both direct and indirect tax concessions to business and individuals for supporting growth. The gross tax revenue peaked during 2008 at 11.52% of GDP. It is not yet back at the same level. Reduction in tax rates has not brought back growth either. It may have helped save the economy from collapse during the crisis period, though!!! Would we know for certain? Probably not, unless we investigate the relationship between reduction in tax rates and consumption and investment decisions in the economy! Such an investigation will require us to estimate the level of economic activity without and with these concessions – not an easy task.
Chart 10
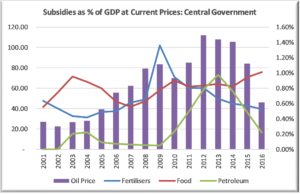
Chart 11
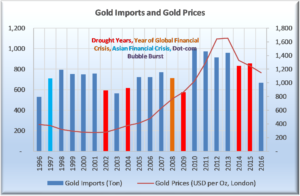
Chart 12
In short, the circumstances and the choice of policy resulted in a situation where the government lost its ability to invest on a sustained basis.
While we still don’t have published information for central as well as the state governments for the year 2017, but we do know that inflation is low, deficits are also at a low level, oil prices have fallen (though they have begun going up), gold imports are lower than in the past, rupee is stronger (though it is getting weaker by the week at present), oil subsidy is down. Growth, however, is yet to return to the earlier levels.
We will, of course, be presenting our analysis of disaggregated resource allocation choices of the government in subsequent articles, along with our analysis around the questions that we raised in this article earlier.
Notes
[1] This article is the first article in a series of articles focused on understanding the the level, structure and behaviour of various aggregates, we will also study the effectiveness of expenditure at a later stage. Each of these articles may raise new questions which we may not have answer for, at a given time. The unanswered questions will provide the basis for our analysis in future. Our first article covers the analysis of aggregate government expenditure, including the state (or provincial) as well as the central (or federal) government.
[2] Drought year refers to the year in which the rainfall during the monsoon period (June to Sep) was lower than the normal rainfall. We have used the Indian Meteorological Department’s data to identify the drought years. Consequently, our charts show the rain deficit during the monsoon season of 2014 as deficit during 2014. On the other hand, the expenditure being shown as 2014 is that for the year April 2013 to March 2014. Hence, it is important for us to interpret the charts carefully. For example, the drought during 2014 (rain season) is expected to result in expenditure going up in fiscal year 2014-15 and not 2013-14.
[3] To be explored in a later paper.
[4] We will explore the impact of growth in agriculture on trade, consumption, savings, investment (particularly education) and social well-being and consequently the quality of life for hundreds of millions of people in India.
[5] Please refer to the discussion on our home page about our premises.
[6] We will present and our analysis on subsidies and gold imports in later articles.