

The Growth Paradox: Will cut in repo rate bring back consumption growth?
Economy has already been slowing down before nCOVID-19 led disruptions hit it.
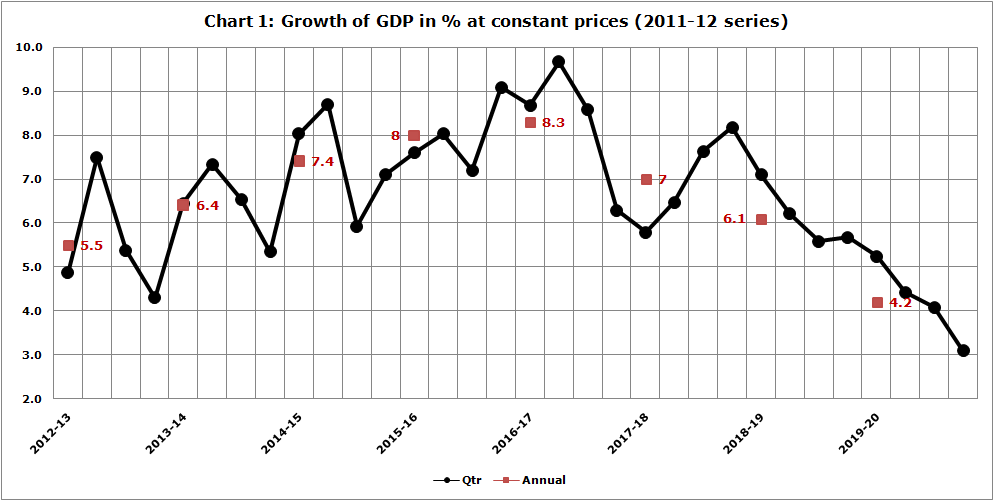
India’s economy, after achieving 8.3% growth in FY17 has consistently been going down. Latest available numbers suggest that GDP growth rate in FY20 is at 4.2% with Q4 FY20 growth number at 3.1% only (Chart 1)[1]. Indian economy is primarily driven by private consumption. Its share in GDP has gone up to 60.3% in FY20 from the level of 56.2% in FY12 (Chart 2). And during the same period share of investments[2] in GDP has gone down to 29.7% in FY20 from 39.6% in FY12.
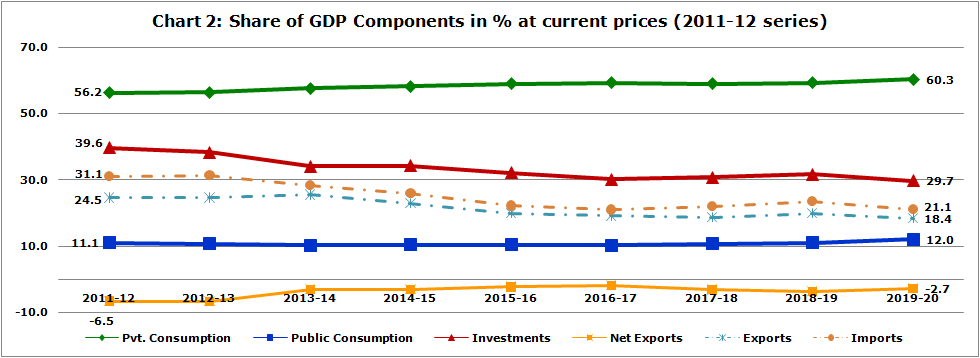
Imports and exports both have gone down in slowing economy. As fall in imports has been sharper than exports, trade deficit has narrowed down to -2.7% of GDP in FY20 form the level of -6.5% of GDP in FY12.
From the above charts it is quite evident that economy has already been slowing down before nCOVID-19 led disruptions[3] hit it. nCOVID-19 led disruptions are further going to accentuate the fall in economy and pose new challenges to our policy makers and industry leaders.
Growth rate in private consumption has been higher than the growth rate in ‘per-capita gross national disposable income’ (per-capita GNDI), in other words financial credits were fuelling the private consumption.
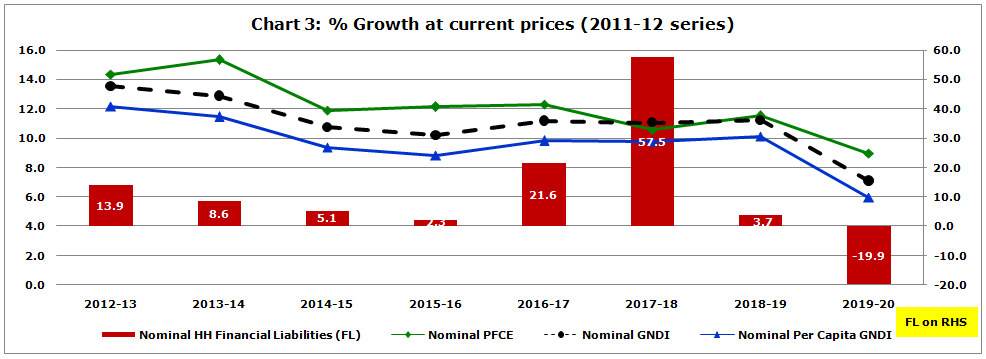
During the period FY12 to FY20, ‘cumulative annual growth rate’ (CAGR) for nominal ‘private final consumption expenditure’ (PFCE) has been at ~12.1%, while the CAGR for nominal per-capita GNDI has been at ~9.7%. During the same period CAGR for nominal ‘gross national disposable income’ (GNDI) has been at ~11.0%. It indicates that private consumption was growing at much faster rate, approximately 2.4 percentage points more than per-capita GNDI (Chart 3)[4] .
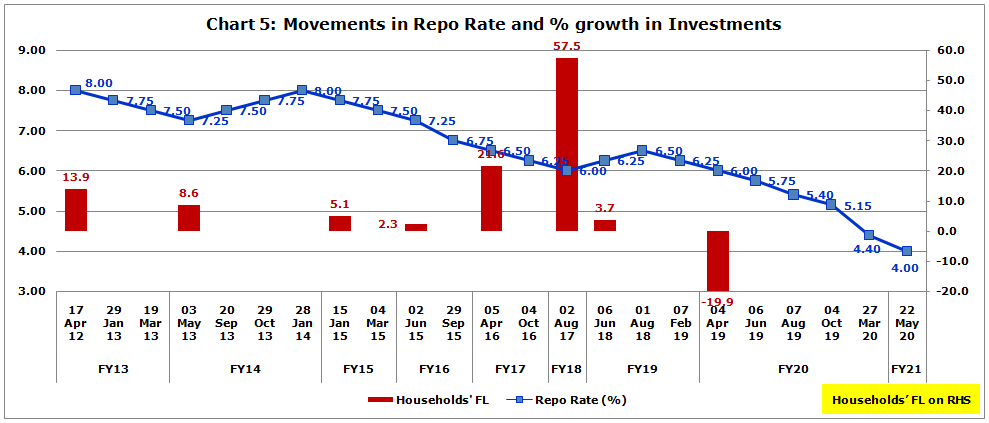
If we look at nominal household’s (HH) financial liabilities (FL), in FY17 it went up by 21.6% and in the following year i.e. in FY18 it further went up by 57.5%. Therefore, it indicates that rather than income it was financial credit, which was fuelling the private consumption. And that is not a sustainable model of growth in the long run.
In real terms growth in private consumption has slowed down significantly, and investments growth has turned negative in FY20.
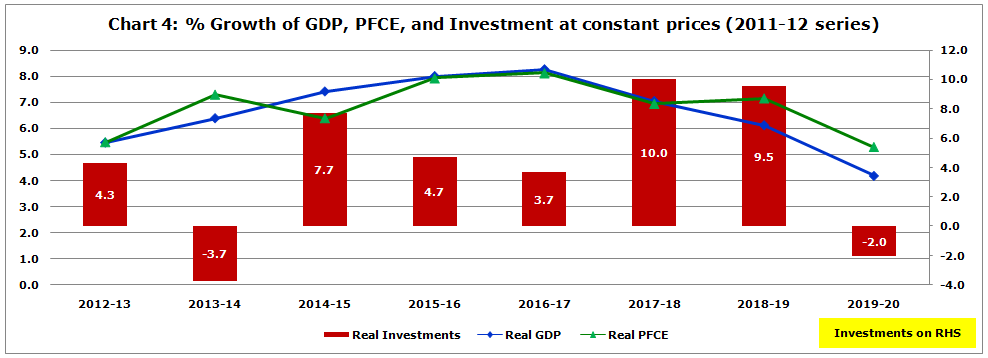
On looking at growth rate of real ‘private consumption expenditure’ (PFCE), we find that its growth rate has come down from the level of 8.1% in FY17 to 5.3% in FY20, which is at the lowest since FY13. It is down by 1.9 percentage points over FY19, which is a quite steep fall (Chart 4)[5]. During the period FY13 to FY20 investments have not kept pace to support the consumption growth. Growth in investments has turned negative in FY20.
Will cuts in repo rate bring back consumption growth?
Despite 210 basis points cut in repo rate during the period 1st August 2018 to 27th March 2020, nominal household’s financial liabilities have gone down by -19.9% in FY20. In FY20 itself, RBI cut repo rate by 160 basis points (Chart 5)[6]. It indicates that households are cutting down on borrowings, and in order to reduce financial exposures they might be repaying the debts. That situation may arise when households are not certain about future income.
At a time when future income is uncertain, who will borrow money, even if repo rate goes down by another 200 basis points?
It is worth mentioning here that suggestions to RBI are pouring in through media to go for much deeper rate cuts. Next meeting of RBI’s ‘Monetary Policy Committee’ is scheduled during August 4-6, 2020, and general expectation is that RBI will go for a minimum 25 basis points cut in repo rate.
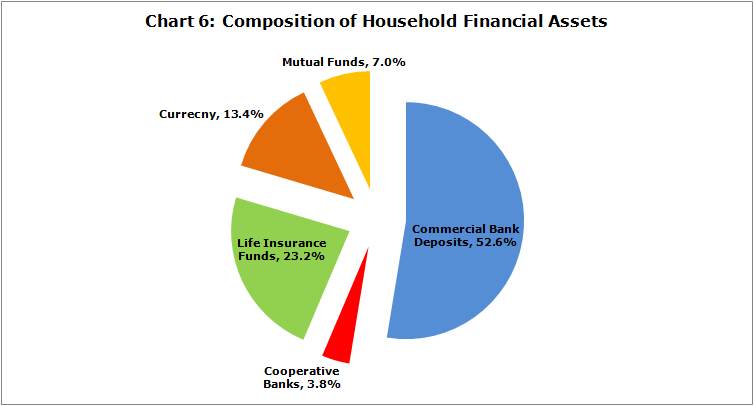
Now question is that when households are cutting down on financial exposures, how will cuts in repo rate help to boost consumption? At present repo rate is at 4.0%, which is the lowest since year 2000. If one considers the latest CPI inflation, which is at 6.09% for the month of June 2020 – announced in 2nd week of July 2020, real effective interest rate is already in negative territory. As households keep 56.4% of their financial assets in the form of bank deposits – commercial and cooperative banks, negative rate erodes their return on deposits (Chart 6)[7].
Efficacy of monetary policy to boost demand under given circumstance and sustainability of credit led growth are under question marks. Corporates would be facing their own challenge to determine demand profile in this uncertain time.
(Outstanding position as at end March 2020)
Acknowledgement
Mr. Anil K Sood, Professor & Co-founder, IASCC, Hyderabad has been a constant source of inspiration to me. He motivates to do research and write on current economic developments. I have been tremendously benefited from his ideas and inputs pertaining to broader economic issues. I am also thankful to IASCC team for making this work available to you.
[1] Chart 1 & 2, Source –CSO Press Note, 31 Jan, & 29 May 2020; FY17-3rd RE, FY18-2nd RE, FY19-1st RE, & FY20-PE
[2] Investments (GCF) = Gross Fixed Capital Formation (GFCF) + Change in Stocks (CIS) + Valuables
[3] First lockdown came in last week of Mar 2020.
[4] Chart 3 & 4 , Source –CSO Press Note, 31 Jan, & 29 May 2020; RBI Bulletin Jun2020 – Quarterly Estimates of Households’ Financial Assets and Liabilities; FY17-3rd RE, FY18-2nd RE, FY19-1st RE, & FY20-PE
RHS – Right hand scale
[5] Chart 3 & 4 , Source –CSO Press Note, 31 Jan, & 29 May 2020; RBI Bulletin Jun2020 – Quarterly Estimates of Households’ Financial Assets and Liabilities; FY17-3rd RE, FY18-2nd RE, FY19-1st RE, & FY20-PE
[6] Chart 5, Source – RBI announcements
[7] Chart 6, Source – RBI Bulletin Jun2020 – Quarterly Estimates of Households’ Financial Assets and Liabilities
ates of Households’ Financial Assets and Liabilities

Growth in household’s financial liabilities in FY19 i.e. 2018-19 was just at 3.7%, which is a steep drop, if we compare it with the growth of 57.5% in FY18 and 21.6% in FY17. This drop is due to choking of financial credit system, which was triggered when IL&FS crisis emerged in September 2018.
This article does not contradict the line of argument that low repo rate is good for investments in the economy. Lower rate is definitely good for the investments in the economy, but what is the definition ‘low’? There must be some reference point, against which we can benchmark repo rate. If we consider the ‘Consumer Price Index’ as a reference point, the current repo rate is too low. Real effective interest rate is already in negative territory.
At a time when there is excess capacity in almost every industry, who will borrow to invest? Households are also cutting down on borrowings, as they see uncertainties over future income. In-fact negative real interest rate is affecting households negatively through erosion of their financial assets at a time when households’ income flow is uncertain.