

Faltering Employment Generation in the Economy
Data[1] suggests that the employment number in the economy was increasing every year from FY 81 to FY 12, but after that employment number has been declining in every subsequent year. To study the change in employment number under various segments of the economy, this paper selects two periods – Period 1, FY 06 to FY 12 (total 6 year), and Period 2, FY 12 to FY 18 (total 6 year); for comparative study. The key findings of the study for ‘Total Economy’, Services, and Manufacturing are as below –
- Total Economy
From an employment generation point of view two key sectors of the economy are – ‘Agriculture & allied’, and Services. In FY 06, both together created 87.7% of total employment. Twelve years down the line – in FY 18, though both together had the same share[2] of employment generation i.e. 87.7%, share of ‘Agriculture & allied’ declined by 13.4% while share of Services went up by 13.4%. Services employed the largest number of people in FY 18, surpassing ‘Agriculture & allied’. Some key highlights are as below –
- Compared to FY 12, in FY 18 the economy employed ~69.1 lakh less people.
- During Period 1 CAGR[3] of employment generation in the economy was at 0.50%, which became negative (0.27%) during Period 2.
- Services were generating employment at the rate of 4.05% during Period 1, but the same became half during Period 2 at 2.05%.
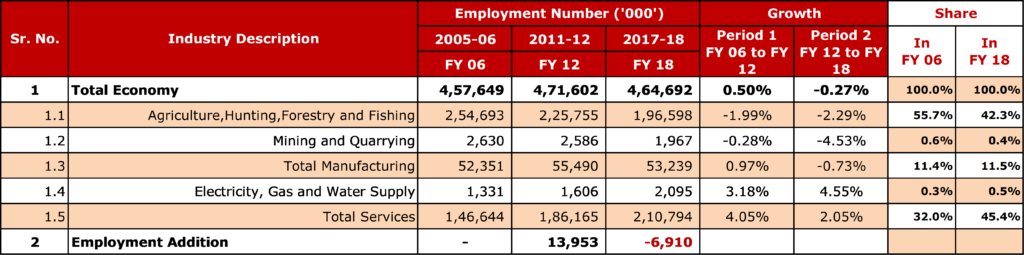
- Decline in employment generation under ‘Agriculture & allied’ accelerated from (1.99%) during Period 1 to (2.29%) during Period 2. It is good that people are moving out of ‘Agriculture & allied’, but other sectors in the economy are not able to generate jobs to absorb them.
- Employment generation growth under Manufacturing became negative (0.73%) during Period 2, which was at 0.97% during Period 1.
- Services
In terms of employment generation Construction, Trade, and ‘Transport & Storage’ are three main categories under Services. Together these three created 60.5% employment under Services in FY 18, share of these three in FY 06 was at 60.3%. Some key highlights are as below –
- Employment generation growth rate under Services has come down to 2.05% during Period 2 from 4.05% during Period 1.
- Construction, which was adding employment at the rate of 9.79% during Period 1, slowed down significantly in terms of employment generation and added employment at the rate of just 1.51% during Period 2.
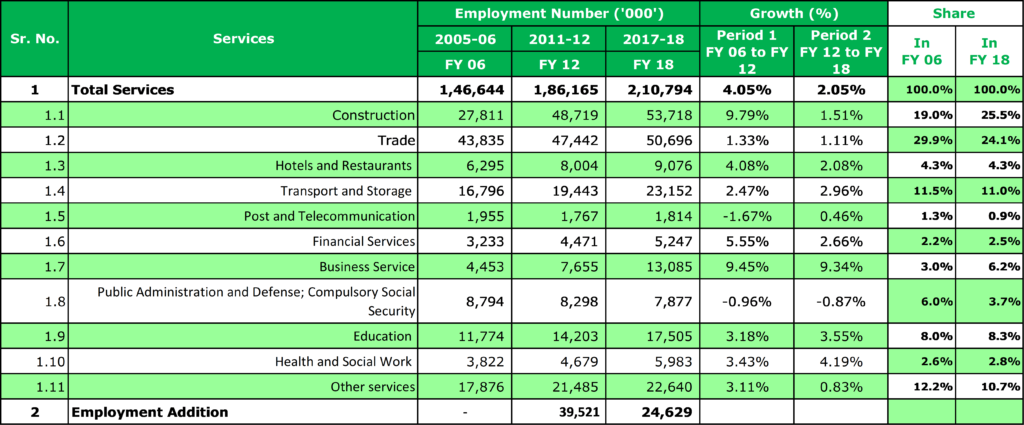
- Trade also added employment at a slower rate. During the Period 2 rate of employment generation was at 1.11%, which was at 1.33% in Period 1.
- ‘Transport & Storage’ did slightly better during Period 2 as it generated employment at the rate of 2.96%, which was at 2.47% during Period 1.
- Manufacturing
Share of Manufacturing in employment generation remained almost unchanged. In FY 06 it was at 11.4%, which went slightly up at 11.5% in FY 18. Under manufacturing the three main categories in terms of employment generation are ‘Food Products, Beverages & Tobacco’, ‘Textiles, Textiles Products, Leather & Footwear’, and ‘Basic Metals & Fabricated Metal Products’. These three categories together generated 52.1% employment under Manufacturing in FY 18. Some key highlights are as below –
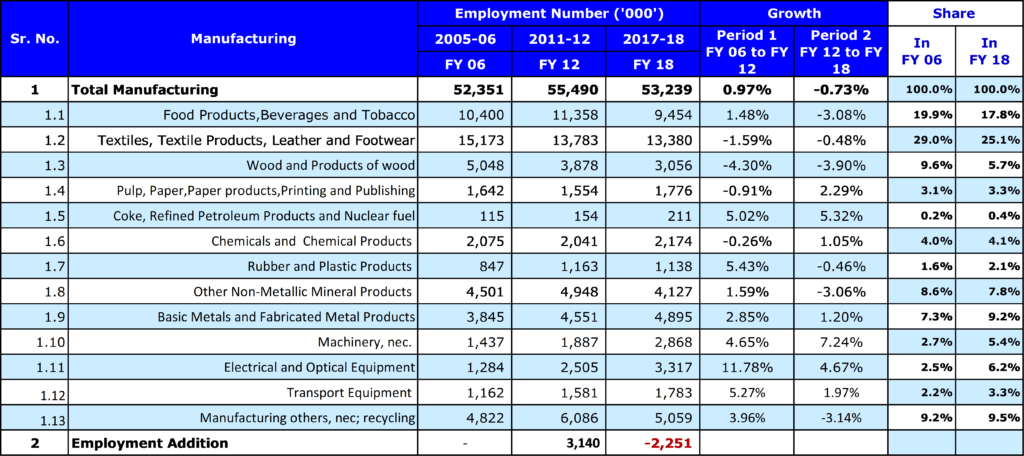
- Compared to FY 12, in FY 18 Manufacturing employed ~22.51 lakh less people.
- During the Period 1 CAGR of employment generation under Manufacturing was at 0.97%, which became negative (0.73%) during Period 2.
- The category – ‘Textiles, Textiles Products, Leather & Footwear’; which is the largest employment generator under manufacturing is not adding jobs, in-fact the number of employment is reducing in this category. Employment growth rates were negative at (0.48%) and (1.59%) during Period 2 and Period 1 respectively.
- Employment growth rate of the second largest category ‘Food Products, Beverages & Tobacco’ was also negative at (3.08%) during Period 2. During the Period 1 this category added jobs at the rate of 1.48%
- Though the third largest category ‘Basic Metals & Fabricated Metal Products’ added jobs during Period 2 but at a declined rate compared to Period 1. It added jobs at the rate of 1.20% and 2.85% during Period 2 and Period 1 respectively.
- Points need to be debated
- What should be done to create employment in the economy?
- Why is manufacturing not creating enough employment opportunities?
- Why is the growth rate of employment creation under services declining?
- Will lack of employment opportunities cause social unrest?
[1] RBI’s KLEMS database – September 2020
[2] Share in total number of employment
[3] Compound Annual Growth Rate