

Economic Rebound: An update & mapping demand outlook under scenario of households’ income loss
Prologue
In order to kick start economic growth government is nudging private sector to invest in capacity creation through announcements of various incentives viz. reduction in corporate income tax rate, production linked incentives (PLIs), etc.
We know that India’s growth story has been primarily driven by credit led consumption growth. During the period FY12 to FY20, growth rate in nominal ‘private final consumption expenditure’ (PFCE) has been at a higher level than the growth rate in nominal per capita ‘gross national disposable income’. In real terms growth in PFCE has slowed down significantly in FY20, while investments growth has turned negative[1].
India has limited risk capital. Banking system is constrained to finance growth, it has limited equity capital to resolve the NPA problem. Therefore, investments led growth has greater financial risk particularly at the time when both global and domestic economic uncertainties are very high[2].
In the post COVID scenario, consumption pattern of households could go through some change. After-all, there is no denying from the fact that a large number of households have suffered from income loss whether it is in the form of salary income or investment income. How this new experience will play out in short to medium term, is very difficult to predict at this point of time.
Considering government’s focus on manufacturing, in the previous article – ‘Economic Rebound: Understanding high impact Sector in Manufacturing’, we tried to understand sectors, where government’s judicious interventions could help economy to rebound quickly. Article used IIP information to analyze various categories from 2012-13 to August 2020. As IIP is a high frequency indicator, it helps us to keep a close watch on a fast developing economic environment on monthly basis.
This article is an update on previous work, and attempts to analyse recently released IIP data for the month of September 2020 in the right context. Article also attempts to map the impact of households’ income loss on demand outlook of various sectors using a 2×2 matrix.
Analysis of manufacturing categories for September 2020
Manufacturing has 23 categories, and 17 out of 23 categories were in red in the month of September last year i.e. Sep-19. If we look at the growth of these 23 categories in Sep-20 over same month of last year i.e. Sep-19, base effect would be at play. Therefore, while looking at the growth in Sep-20 over Sep-19, we should also look at growth in Sep-20 over Sep-18, and growth in Sep-19 over Sep-18. Along-with month on month growth numbers, H1 FY21 growth numbers are also given in the table below.
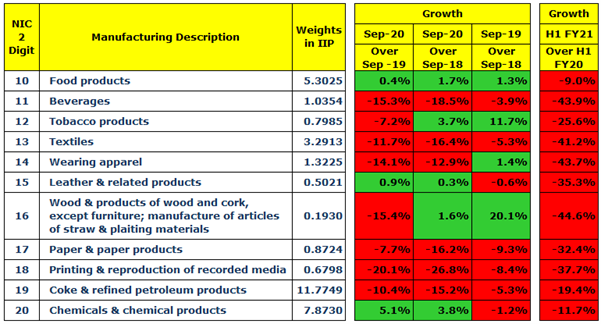
- Food Products
Food products category has grown in Sep-20, albeit slowly at 0.4%. Though it does not get impacted much by income loss, its growth would slow down if the current economic situation lasts for long.
- Textiles
This is one of the largest employment generating sectors. Its decline is in double digit (-11.7%) despite favourable base effect. Over Sep-18, it has declined by 16.4%.
- Wearing Apparel
Decline in another large employment generating sector is in double digit (-14.1%). This category had registered a modest growth of 1.4% in Sep-19.
- Paper & Paper Products
Despite favourable base effect this category declined by 7.7%. Decline in Sep-19 was at -9.3%.
- Coke & Refined Petroleum Products
Surprisingly this category is down by double digit (-10.4%) despite having a favourable base effect. Over Sep-18, it has declined by 15.2%.
- Chemicals & Chemical Products
This category has registered a growth of 5.1%. It has a favourable base effect as its growth in Sep-19 was negative.
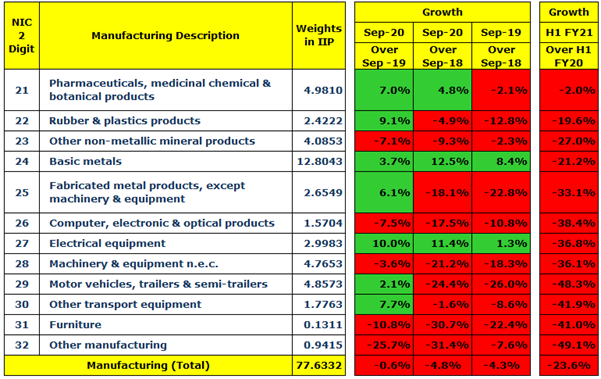
- Pharmaceuticals, Medicinal Chemical & Botanical Products
This category has registered a growth of 7%. It has a favourable base effect as its growth in Sep-19 was negative.
- Rubber & Plastics Products
This category has registered a growth of 9.1%. It has a huge favourable base effect as its decline in Sep-19 was in double digit (-12.8%). Therefore, its growth in Sep-20 over Sep-18 is negative (-4.9%).
- Basic Metals
This category is doing well. It has registered a growth of 3.7%. In Sep-19, its growth was at 8.4%.
- Electrical Equipment
This category is doing quite well. It is the only category which has registered a double digit growth in Sep-20, it grew by 10%. In Sep-19 also it was in green as it registered a growth of 1.3%.
- Motor Vehicles, Trailers & Semi-trailers
This category has registered a growth of 2.1%. It has a huge favourable base effect as its decline in Sep-19 was in double digit (-26%). Therefore, its growth in Sep-20 over Sep-18 is negative (-24.4%).
- Other transport equipment
This category has registered a growth of 7.7%. It has a favourable base effect as its decline in Sep-19 was at -8.6%. Therefore, its growth in Sep-20 over Sep-18 is negative (-1.6%).
Analysis of use-based categories for September 2020
Primary Goods, and Capital Goods have declined further in Sep-20 despite having favourable base effects. Intermediate Goods show a dip in Sep-20. Infrastructure / Construction Goods, and Consumer Durables have shown slight uptick as both have favourable base effect. But over Sep-18 both are in red. Consumer non-durables has registered a growth of 4.1%.
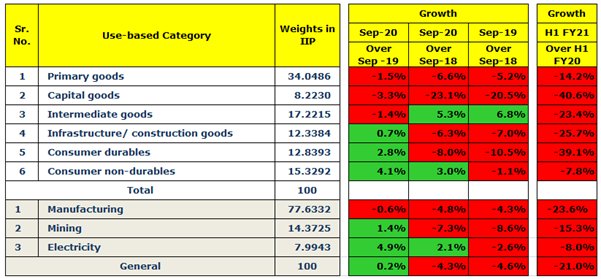
Overall, Manufacturing is down by 0.6% in Sep-20 despite having a favourable base effect. Mining shows slight uptick but it is still down by 7.3% over Sep-18. Electricity registered a growth of 4.9%.
Impact of Income loss on demand outlook of various sectors
One of the harsh realities of the ongoing crisis is that households’ income has been impacted negatively. Probably it would be the first time when in the post reform era a large number of households’ have suffered from loss of income, whether it is in the form of salary income or investment income. People have lost jobs, people have been retired prematurely, and people have taken salary cuts. How will this new experience change the consumption behaviours of households? Will they continue to borrow and spend as they were doing till recently? Will the nature of contract between employees and employers go through a change? It is very difficult to predict households’ likely response at this point of time. In such an indeterminate situation, how to look at the demand outlook of various sectors?
We attempted using a 2×2 matrix which has two dimensions value-chain complexity and socio-economic effects/nature of demand to map various sectors[3].
Value-chain complexity refers to interdependencies i.e. to the extent to which products and services are dependent on the other elements for meeting the needs. If a value chain resembles a dense network of activities or people, which get influenced by each other, it’ll have high complexity.
And socio-economic effects of demand or nature of demand refers to the extent to which the existing economic and social equilibrium are impacted when households suffer from loss of income for considerable a period of time and households see uncertainties over future income. The matrix has following 4 quadrants –
1. Field Land
(Immediate Nature of demand; Low value-chain complexity)
In this category demand does not vary significantly, but if the present crisis continues for long, this category will also get negatively impacted. Probably that is the reason ‘Food Products’, and ‘Pharmaceuticals …’ have not been impacted much in H1 FY21. Apart from those two sectors, firms operating in the space of Agri-inputs, Fertilizers, etc would also not see much demand contraction.
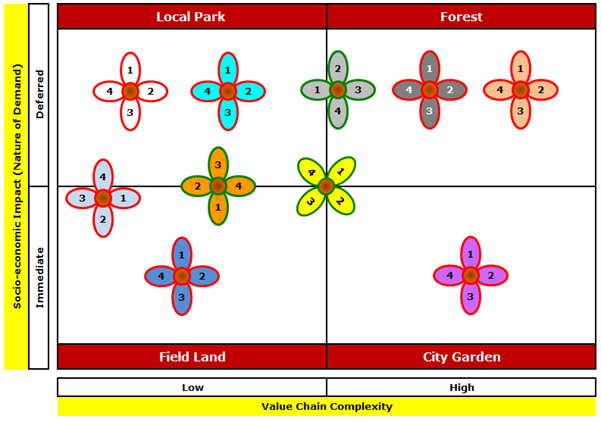
2. Local Park
(Deferred Nature of demand; Low value-chain complexity)
This category generally covers non-essential nature of demand. As demand depends on discretionary incomes and savings of households, it slows down. Probably that is the reason we see 39.1% contraction in demand of consumer durables in H1 FY21. White Goods, Tourism, etc. belong to this category.
3. City Garden
(Immediate Nature of demand; High value-chain complexity)
This category is characterized by pooled and network interdependencies, and hence constraints to demand are interactions and networks. Transport services come under this category. And as the nature of the current health crisis is highly contagious, transport services are going to be badly affected.
4. Forest
(Deferred Nature of demand; High value-chain complexity)
In this category products and services offered do not make a difference from one day to another, but potentially yield gains in the long run. Government’s investments and policies influence demand in this category. Probably that is the reason manufacturing category ‘Basic Metals’ is doing well.
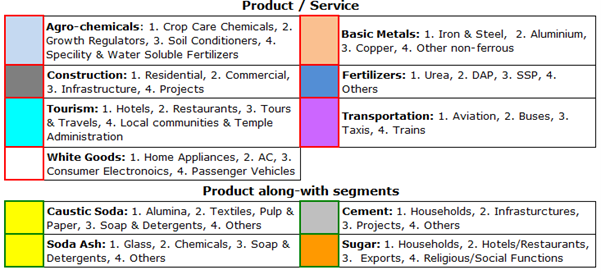
Placing products in the matrix
Generally a product goes to different segments and those segments could lie into different quadrants – Field Land, Local Park, City Garden, and Forest; therefore, it becomes quite complex to analyze demand outlook for a product. To explain the concept of this framework, products – Caustic Soda, Cement, Soda Ash, and Sugar are mapped into the framework.
You may please download and read the complete article below:
Data Sources:
- IIP data September 2020, Ministry of Statistics and Program Implementation, Government of India
Bibliography:
- Economic Rebound: Understanding high impact Sectors in Manufacturing, Anand Shanker Pandey, IASCC, Hyderabad, October 27, 2020
- Mental Models: How do they help navigate Indeterminate Situations?, Anil K Sood, IASCC, Hyderabad, October 1, 2020
- Post COVID-19 Lockdown Business Context: Navigating Strategic and Organizational Choices, Dr Anujayesh Krishna, IASCC, Hyderabad, May 28, 2020
- The Growth Paradox: Will cut in repo rate bring back consumption growth? Anand Shanker Pandey, IASCC, Hyderabad, July 26, 2020
- The Indian Economy: Making a Case for the Government to Play its Economic Role, Anil K Sood, IASCC, Hyderabad, April 16, 2020
Acknowledgement:
I am grateful to Prof Anil K Sood, Professor and Co-founder, IASCC, Hyderabad for his insightful inputs.
[1] The Growth Paradox: Will cut in repo rate bring back consumption growth? Anand Shanker Pandey, IASCC, Hyderabad, July 26, 2020
[2] The Indian Economy: Making a Case for the Government to Play its Economic Role, Anil K Sood, IASCC, Hyderabad, April 16, 2020
[3] Adapted the framework used in article ‘Post COVID-19 Lockdown Business Context: Navigating Strategic and Organizational Choices’, Dr Anujayesh Krishna, IASCC, Hyderabad, May 28, 2020

Quick observations on the reported Q2 FY21 GDP numbers is as follows-
GVA Manufacturing shows a growth of +0.6%, while IIP numbers for manufacturing suggest a contraction of -6.8%.
One explanation for deviation is that PROFITABILITY (EBITDA) might have improved in manufacturing. There is no doubt that prices have gone up in certain cases viz. polymers, metals, etc;; and costs – raw materials, logistics, overheads, salary, etc; have come down, which might have helped in improving EBITDA.
But the million dollar question now is, whether those margin improvements are so significant?
Lockdown fatigue is definitely there, but it being a heath crisis people don’t have much option. They have to continue curtailing their activities till vaccine or effective medicines are available. It is observed that people and companies are trying to get back to the pre-COVID lives. It all depends on how do they perceive the threat, but in my opinion efforts of going back to pre-COVID lives would not be sustainable till medical solution is available. Delhi could be an example in that context. Though government is trying its best to revive economy, I think turnaround is still not around the corner. But I am sure that things would start looking up soon. Indian economy was not doing well even before March-20, COVID has just exacerbated the economic problem.