Do Steep Price Increases destroy Markets?
The Case of Housing Market in India
In the housing market, we define affordability as the House Price to Income Ratio.
The Reserve Bank of India in its Residential Asset Price Monitoring Survey, July 11, 2019 and Recent Trends in Residential Property Prices in Indian: An Exploration using Housing Loan Data, May 7, 2015, suggests that the median House Price to Income (HPTI) ratio has worsened from 56.1 in March 2015 to 61.5 in March 2019. During the same period, the Loan to Income (LTI) ratio has worsened from 3 to 3.4, which was at 2.8 in 2009-10. In other words, the house purchases are being funded through an increasing amount of debt.
In this short article, we look at aggregate information to understand how prices in the Indian housing market has evolved during the last 10 years. The house price index is an aggregate of indices across 10 large Indian cities, weighted by the population. Our data sources are the RBI’s House Price Index and the HBS_Table_No._01___Macro_Economic_Aggregates_(at_Current_Prices).
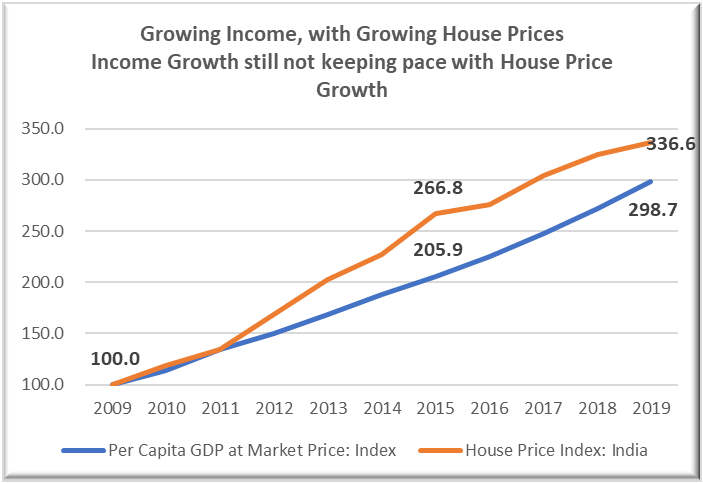
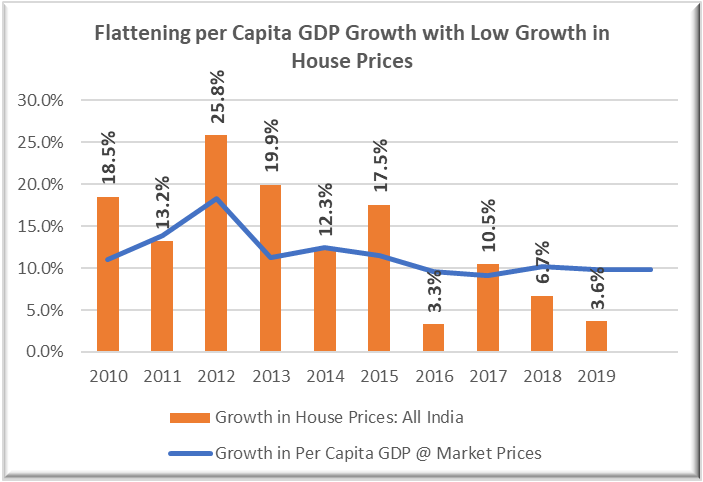
Chart 1 shows how the gap between increase in house prices and per capita GDP has grown over the years. While the gap peaked during 2014-15, it continues to be high even when the growth in house prices has been declining after having peaked at 25.8% during 2011-12 (Chart 2).
Chart 1

Chart 2

Sharp increases in price in short period, without correction (read decline), particularly when the income growth has been flattening is naturally expected to make buyers careful about buying homes for their own use or investment. Given the level of inequity in distribution, if the house price increases are similar across segments, the affordability at the lower end of the market takes an even bigger hit.
If the home buyer is an investor (not buying for family use), the concern about price correction is likely to hold back the investment decision. At the same time, if the income growth is flattening, as seen since 2013-14 in Chart 2, (particularly after the cumulative peak gap of 60.9 index points during 2014-15 in house price and income growth – Chart 1), we would not expect the home purchases to start growing anytime soon. The gap between house price increase and growth in income has been so significant till March 2015 (peaking at 60.9 index points) that the recent deceleration in growth has not really corrected the affordability gap.
In other words, at this stage, neither the sentiment about price increase (for investor) nor the prospect of increasing income are positive. It is therefore not surprising that the housing market is really stalled at this stage. All recent surveys point to a stalled market.
While the industry has been looking for a solution in cheaper credit and liquidity on tap, our assessment is that the problem is elsewhere – the affordability gap. Either the prices have to come down or the incomes have to grow.
Unsold Houses at All time High
Fall in Housing Sales


