

Role of the State in Economic Development: Does India need to look beyond the Invisible Hand?[1]
The International Monetary Fund (IMF) has often advised India that it needs further reforms and fiscal consolidation measures owing to its steadily rising debt levels.[2] It is not the first time that India and many other developing nations have received such an advice. It will also not be the last time, as IMF’s advice is based on its faith in an open, market-based system where the ‘government failures’ dominate ‘market failures’.
At the same time, S&P Global Ratings, while affirming the long-term sovereign rating at BBB-, flagged off rising fiscal deficit and increasing government debt as its twin concerns.
The Economic Survey (2018-19 and 2019-20) was worried about fiscal deficit and argued for fiscal consolidation.[3] The Survey’s recommendations for policy makers are also grounded in the same orthodoxy that IMF and S&P base their recommendations on. [4] While there have been some voices[5] that have challenged this orthodoxy, particularly post the global financial crisis, the core principles that guide IMF’s advice remain the same – fiscal consolidation, austerity, and capital account liberalisation. For example, in a blog, related to release of World Economic Update, Dr Gopinath has reiterated IMF’s long held belief and suggested[6] the following:
“All initiatives will need to be embedded in medium-term fiscal frameworks that lay out a credible path for ensuring public debt remains sustainable.”
To Dr Geeta Gopinath’s credit, during her recent visit to India, she did suggest that “the fiscal policy must remain accommodative in the near term” in the Indian context.[7]
In this discussion paper, we argue for an active role for the state under all circumstances, given the stage of economic development in India. We suggest that India moves away from ideology-based policy choices to context-based choices. Our analysis highlights the fact that the India’s context requires the Indian state, along with Indian households and the business, to invest in enhancing their ability to grow. If not, India runs the risk of not being able to realise its potential.
Consistent investment in economy’s ability to grow would not only provide for better life for people, it would also help financial markets avoid episodes of exuberance and despair – episodes that have very little to do with volatility of economic growth but have often forced the central banks to rescue financial investors or tailor monetary policy that provides them with the ‘central bank put’.[8] [9] [10]
Table 1: Growth and Volatility: Indian’s GDP and Equity Market

India’s Socio-Economic Context
During the last quarter of a century, India has done well to raise its per capita income to USD ~2,000, from just about USD 400. However, it has lost its growth momentum – first post the global financial crisis (GFC) and then after implementation of a couple of policy reforms, i.e., demonetisation and the Goods and Services Tax (GST).
During this period, India has also experienced many adverse internal and external events including the Asian financial crisis (1997), the dot-com bubble burst (2001), the global financial crisis (2007) and the frequent droughts (2002, 2004, 2009, 2014 and 2015)[11].
Given the loss of growth momentum, India faces greater uncertainty from technological discontinuities that are paving the way for the fourth Industrial Revolution.
The pandemic makes the situation to be even more difficult, as there has been a significant decline in growth across sectors. While it is important to recover quickly from the collapse caused by the pandemic, it is equally important, if not more, to identify investments that can help accelerate growth in the post-pandemic world. If not, India runs the risk of falling into the “middle-income”[12] or the “development”[13] trap.
A country’s ability and willingness to invest in its future is a function of the level of earnings and wealth, distribution of household wealth and variability of their earnings. If India is not able to rebuild its growth momentum and recover from the current collapse, it would struggle to provide for even the basic needs for the world’s second largest population.
Indian businesses, particularly small and medium enterprises (MSME), do not have adequate risk capital, which limits their ability and willingness to invest in economic activities that involve taking risk and require them to deal with uncertainty. Therefore, the Indian state must use its status of risk-free borrower to invest and help people build the ability to take risk.
India’s socio-economic context continues to be that of a young, low-middle income country with millions of poor households who are dependent on agriculture and low value-adding informal employment and consequently have very limited risk capital to invest in their future. Not to forget that many of these households have been at a significant disadvantage across generations, e.g., limited economic mobility resulting from deep-rooted social divisions.
In an uncertain environment, the business leaders tend to stay away from investing ahead of demand and thereby causing the growth to slow down. Since the corporation is only an intermediary in the risking-taking and wealth-creation process, as it raises the required risk-capital from households and reinvests profit on their behalf, the business leaders are guided by investor preferences. If the investor sentiment is weak, the business leaders tend to be risk averse.
The state can support the Indian business and households by investing in productive capacity ahead of demand, which would help ensure that the economic progress does not get stalled even if invest and, consumer sentiment is weak, as has been the case for many years now.
We argue that it is this context that must guide policy choices rather than economic orthodoxy, as we do not have conclusive evidence on any of the problems (deficits cause inflation, government spending crowds out private investment, government failure, etc.) that the economic orthodoxy cites for limiting the state’s role.
We expect the state to help households and the Indian MSMEs build their ‘ability to grow’ by helping them accumulate risk-capital over time, which, in turn, allows them to ‘deal with uncertainty’. We, therefore, urge the Indian state to increase its investment in building economic and social infrastructure and creating employment so that household earnings grow consistently, and they don’t have to buy basic services like education and healthcare in private markets where the prices are higher by the very design of these markets.
In this discussion paper, we have attempted to explore the following aspects to argue our case for an active economic role for the Indian state:
Key characteristics of the Indian economy: A Low-Middle Income, Agriculture-dependent, Low Value-Adding Economy with Limited Risk Capital
India’s Economic Performance post early 1990s reforms: Acceleration that seems to have lost Momentum
Recent Economic Surveys: Do they identify the policy premises that are grounded in India’s reality?
Economic Role of the State: A Night-watchman or an Active Participant?
Government Spending and Economic Growth: Wagner’s Law
Economic Uncertainty and the level of Government Expenditure in India
Growth in Agriculture and its relationship with Economic Growth in India
Government Deficits and Inflation in India
Nature of Resource Mobilisation and its impact on India’s ability to invest for growth
1. Key Characteristics of the Indian Economy: A Low-Middle Income, Agri-dependent, Low Value-adding Economy with Limited Risk Capital
India is a low-middle income country, with nearly two-thirds of its population living in rural areas. It is a young country too, with median age being less than 30 years. India also has one of the poorest populations in the world. The poor need income support for buying even the basic needs. Given its size and the stage of development, India also needs a large amount of investment in physical, economic, and social infrastructure.
India is a Large Economy with Low Per Capita Income and large Employment in Low Value-adding Economic Activity
The Indian economy currently ranks number 3 globally, with its GNI – PPP (current international $) at $10.39 trillion, with China and USA topping the table. However, India ranks 120 on per capita basis, with its GNI per capita – PPP (current international $) at $7,680, with the US and China at number 12 and 72, respectively. India’s rank on Human Development Index is very similar to its per capita GNI ranking (India ranks 129 among 189 countries), with about 20% of India’s population living under its national poverty line.
Chart 1 below informs us about the distribution of income and its behaviour during the last three decades. We observe that the middle 40% of the population has experienced a significant decline in its share of national income, which implies that there has been a relative decline in their ability to invest in their own and, their children’s future.
In comparison, the income share of top 10% in USA and China is at 45.5% and 41.7%, respectively. The US and China have also experienced a lower increase in income share of Top 10% than that in India. It is, therefore, not surprising that the US and China are the world’s largest economies and have been able to grow consistently for decades even under adverse circumstances. Both have a strong ability to invest for growth and have created a large middle-income consumer base.
Chart 1: Steep decline in share of income for 90% of the Indian Population
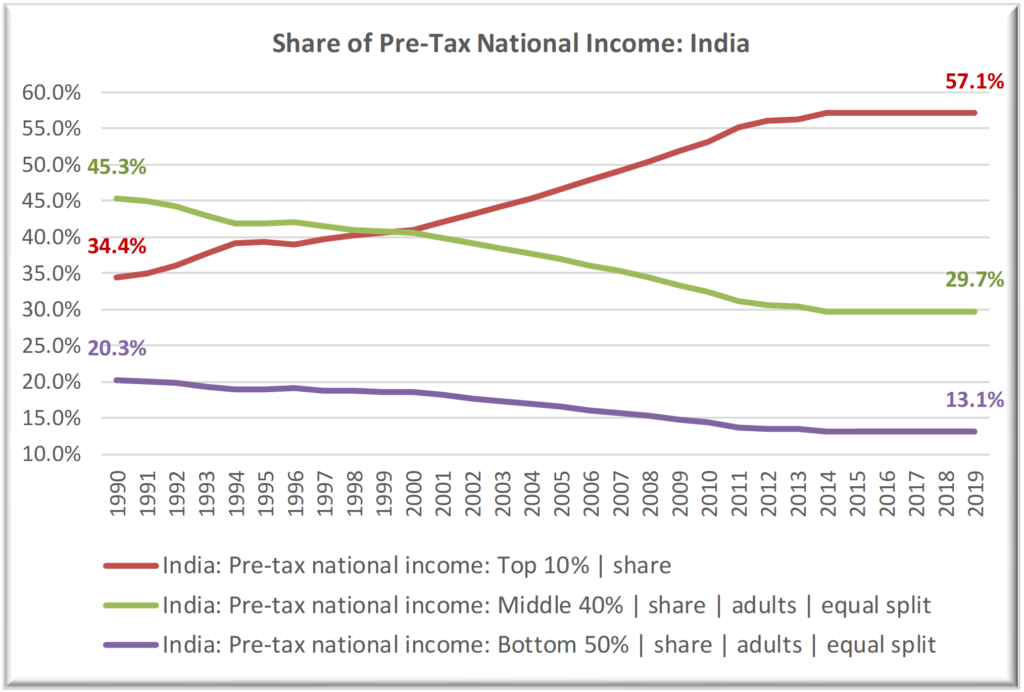
Source: World Inequality Database, accessed on Sep 23, 2021.
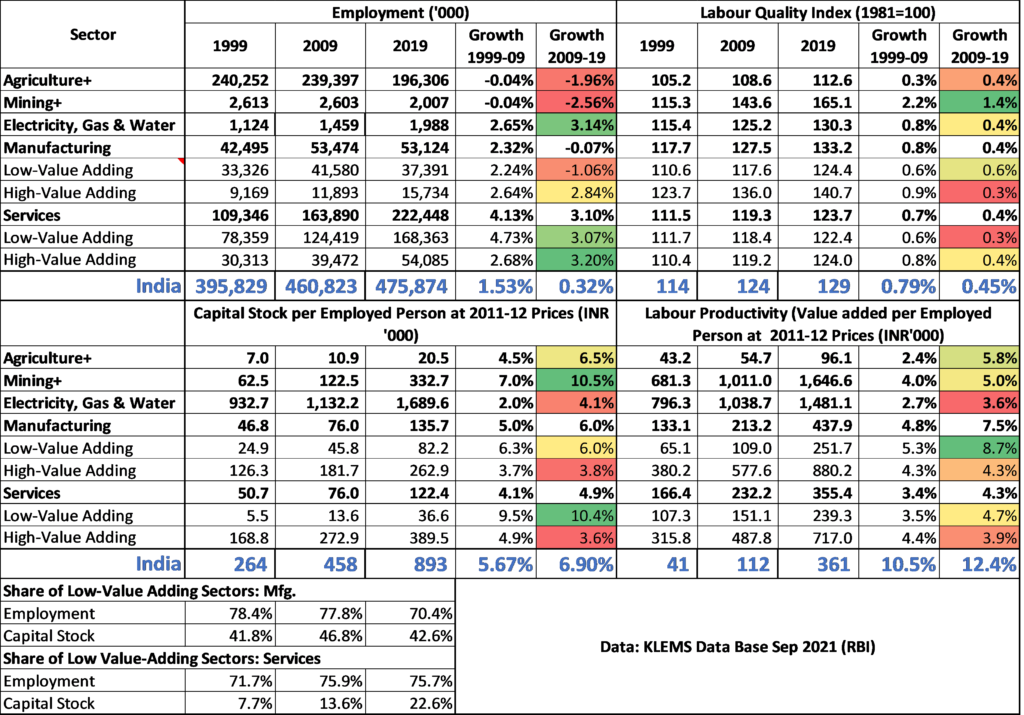
One of the main reasons for India’s low per capita income and the skewness in its distribution is that it is largely a low value-adding economy and its progress towards being a high value-adding economy has been particularly slow (Table 2). [14] We would also like to stress that ~40% of employment is still in the Agriculture, Hunting, Forestry and Fishing sector, where the value-adding per person, by the very nature of activity, is about one-fourth of the country’s average.[15]
Low Per Capita Income implies Low Per Capita Savings, which limits India’s ability to invest and take risk
While an average Indian is considered a saver, the absolute amount of per capita saving is naturally low, as the average per capita current income is just INR 141,265 (~USD 2,000). The average gross household saving rate is currently at ~19.0% of GDP, implying a per capita saving of ~USD 380. Income and saving rates for agricultural households is even lower. Situation Assessment of Agricultural Households (NSS Round 77, Sep 2021) estimates the monthly household income to be INR 10,084, which is just ~ USD 1,700 per annum for a five-member household or a per capita income of ~USD 340.
Table 2: Employment, Value-addition, and Productivity by Sector
Low absolute income and saving levels imply that a typical household saves a significant part of its surplus in physical (e.g., home, gold, etc.) rather than financial assets. When it comes to investment in financial assets, there is natural preference for bank deposits (50% of financial savings), insurance (20%), post retirement saving plan (~12%) and currency (~10%), leaving less than 10% for capital market investment.
In short, a typical household is a risk-averse household, which is not surprising given the level of poverty and average absolute saving amount.
Low Income and Low Savings, combined with ‘economic uncertainty’ caused by uncertain rainfall compromises India’s ability to grow even further.
A recent study by the Asian Development Bank[16] reports that “rainfall has high predictive content for GDP growth.” The study goes on to report the following:
“At the first sight, the importance of rainfall is surprising given that agriculture and allied activities account for only 16% of overall output. However, the sector continues to support more than 47% of the workforce and hence, large deviations from normal rainfall adversely affect the earning potential of these workers, which in turn depresses private consumption. Rainfall remains vital to agricultural productivity due to the pervasive scarcity of water supply (World Bank 2018). Around 52% of overall cropped area in India remains without irrigation, with certain regions being chronically water stressed (Mishra 2017).”
The ADB study uses recursive correlation between absolute deviation of rainfall from normal and food production growth and private consumption, as both deficit and excessive rainfall can have an adverse impact. The report states that “the correlation is mainly negative and has intensified in recent years implying that deviant rainfall has been associated with lower food production compared to earlier years. A similar pattern emerges when we evaluate the relationship between rainfall deviation and private consumption growth although it remains weaker compared to food production growth.”
During the recent years, the contribution of agriculture has been growing and that of manufacturing declining, implying increased dependence on uncertain earnings for two-third of India’s population. It is, therefore, important that we invest in agriculture to improve the level as well as the consistency of earnings for agriculture households, particularly in view of the fact that we have not been able to create the required level of employment in high value-adding manufacturing and service activity. As mentioned earlier, the current level of earnings of an agricultural household leaves them with no capital to take risk and invest for future. They can neither invest for upgrading their skills nor invest to improve the productivity of agricultural operations.
Chart 2: Agriculture and Manufacturing GVA at Constant Prices
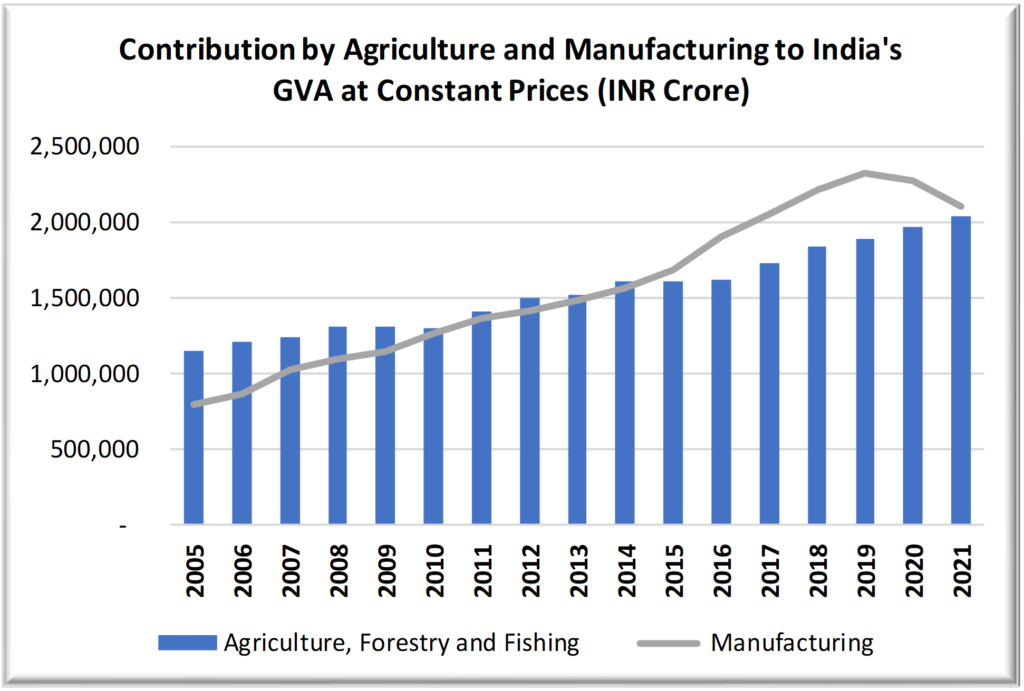
Source: Components of Gross Value-Added, RBI’s Data Base of Indian Economy
2. India’s Economic Performance Post early 90s Reforms: Acceleration that seems to have lost Momentum
Post the external balance crisis during the early 90s, India started dismantling many structural barriers for domestic as well as international private investment. After the first couple years of low growth, the Indian economy moved up from 5-6% growth to 7-9% growth, though it experienced a severe setback post the global financial crisis (3.1% during 2008-09). While the growth rate recovered well to reach ~8% during FY 2015-16, it slowed down to ~6% during the fiscal year 2018-19.
Chart 3: Growth uptrend post-90s Opening up of the Indian Economy [17]
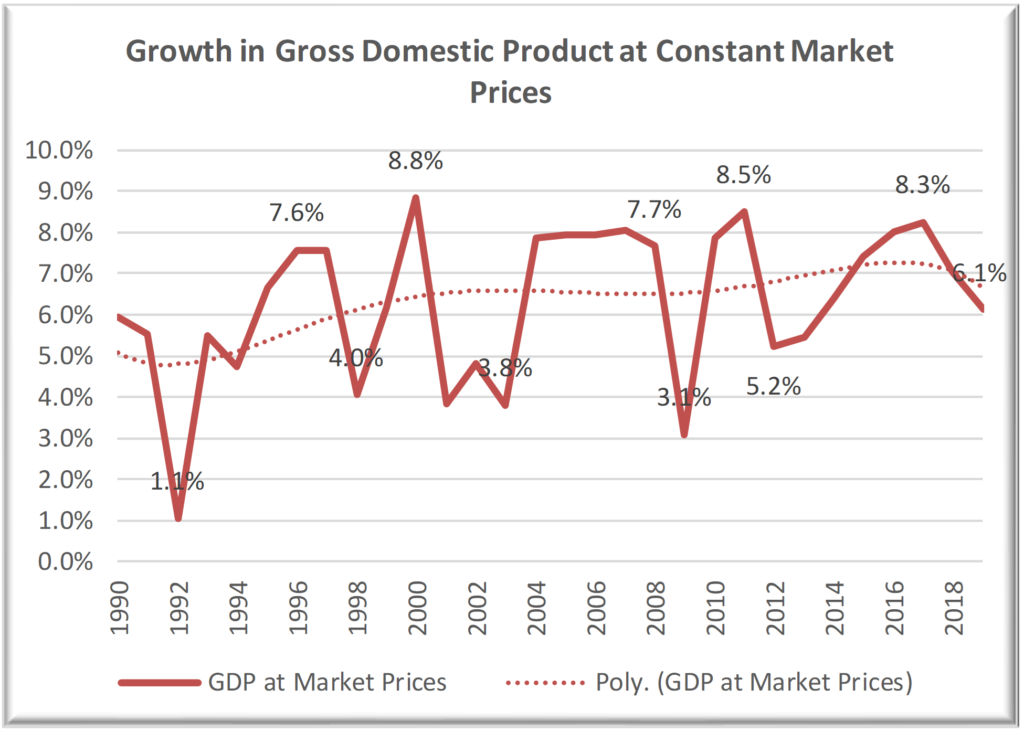
Source: Macro Economic Aggregates, RBI’s Data Base of Indian Economy
The period of current slowdown coincides with a few significant policy changes, e.g., demonetisation, introduction of Goods & Services Tax or GST, Real Estate (Regulation & Development) Act or RERA, Insolvency & Bankruptcy Code (IBC), etc. The current fall in growth rate is easily explained by a fall in gross capital formation, a decline from a peak of ~38% of GDP to about 30% of GDP at Current Market Prices.
Chart 4: Declining Annual Gross Capital Formation Level
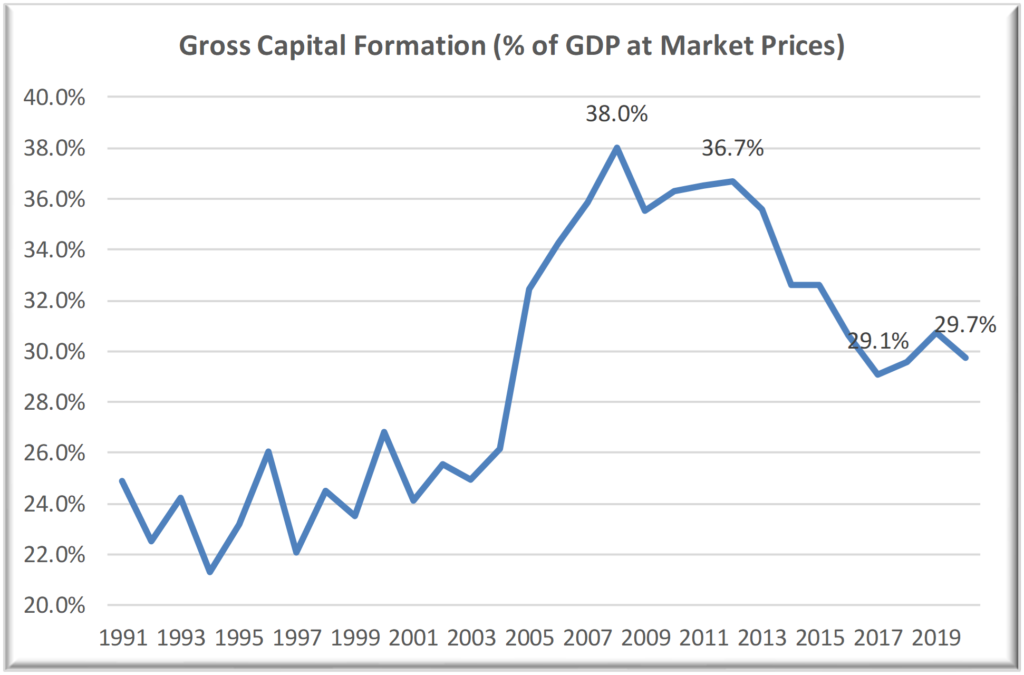
Source: Macro Economic Aggregates, RBI’s Data Base of Indian Economy
The quarterly momentum of growth (Chart 5) signals an even bigger challenge than highlighted by annual growth trend in Chart 3.
Chart 5: Near collapse of Quarterly Growth Momentum[18]
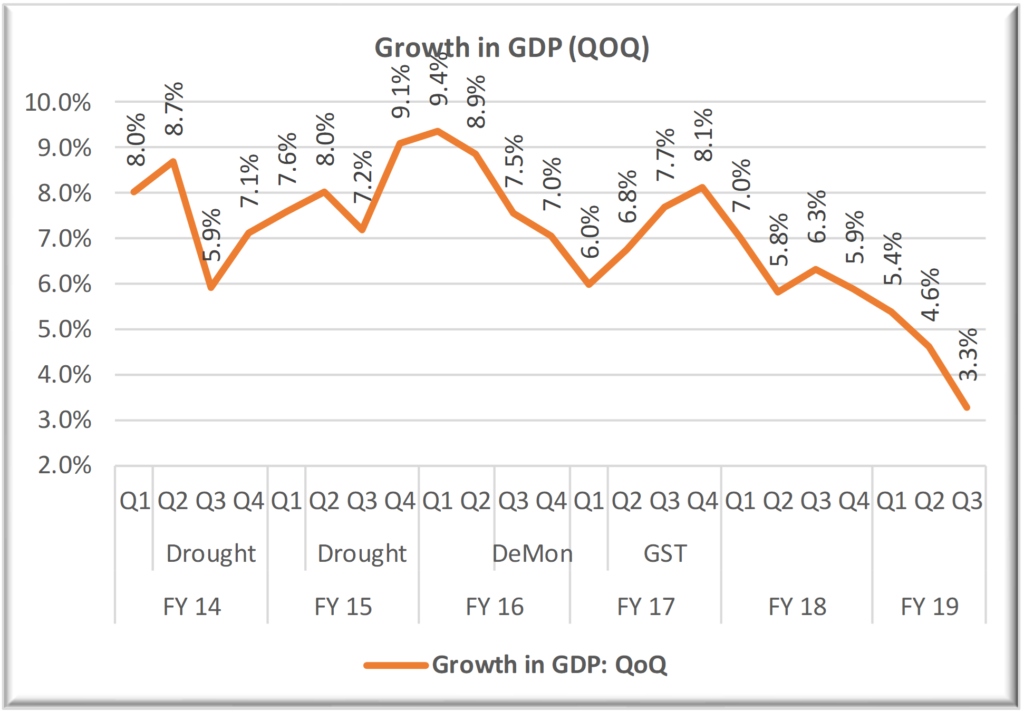
Source: Various Quarterly Releases of Ministry of Statistics and Programme Implementation (MOSPI)
Chart 6: Declining Growth of Private Final Consumption Expenditure (PFCE)[19], and….
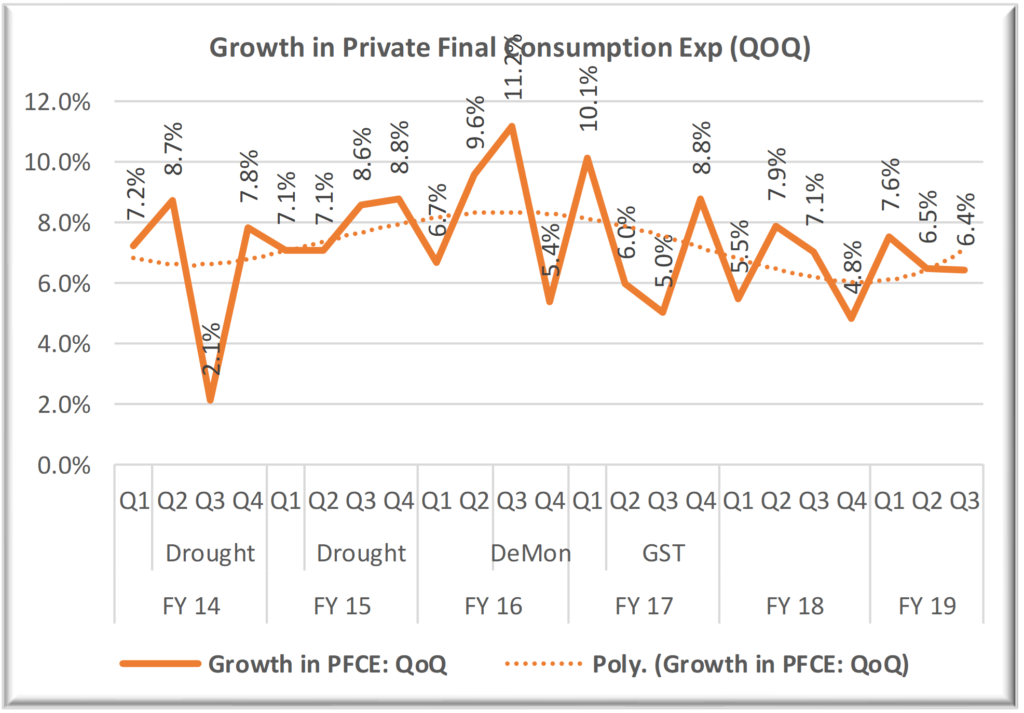
Source: Various Quarterly Releases of Ministry of Statistics and Programme Implementation (MOSPI)
Chart 7: …near-Collapse of Growth in Gross Fixed Capital Formation (GFCF) Level
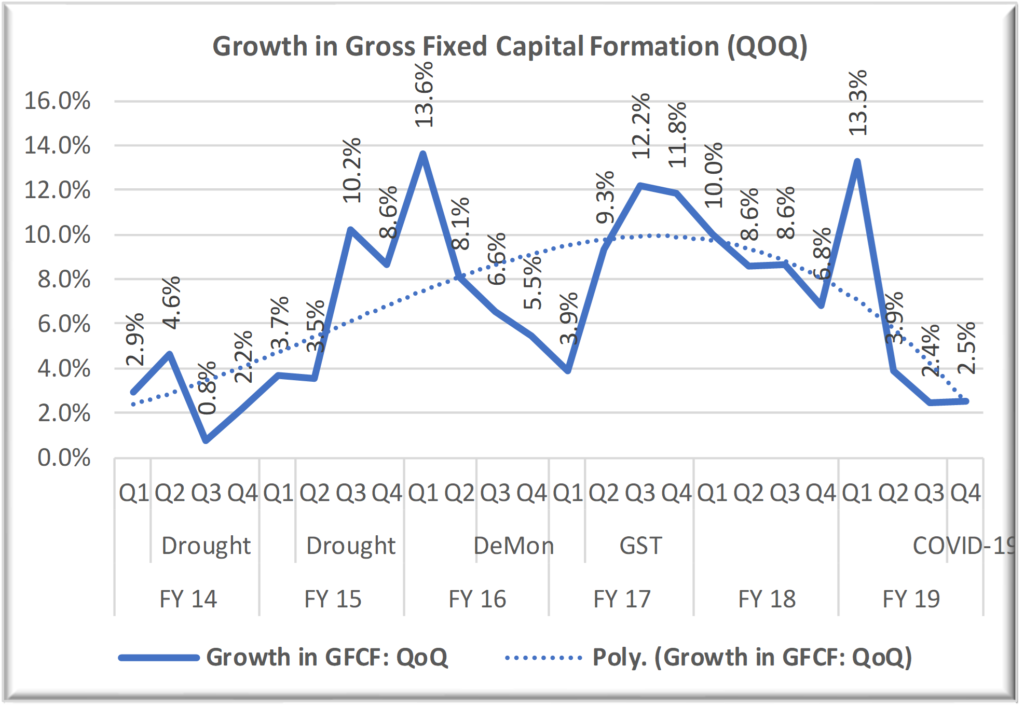
Source: Various Quarterly Releases of Ministry of Statistics and Programme Implementation (MOSPI)
The Indian urban consumer’s confidence is at its lowest level since 2012, and it has been declining since March 2017, implying 3-years of pessimism about the current situation.
Chart 8: Declining Consumer Confidence[20]
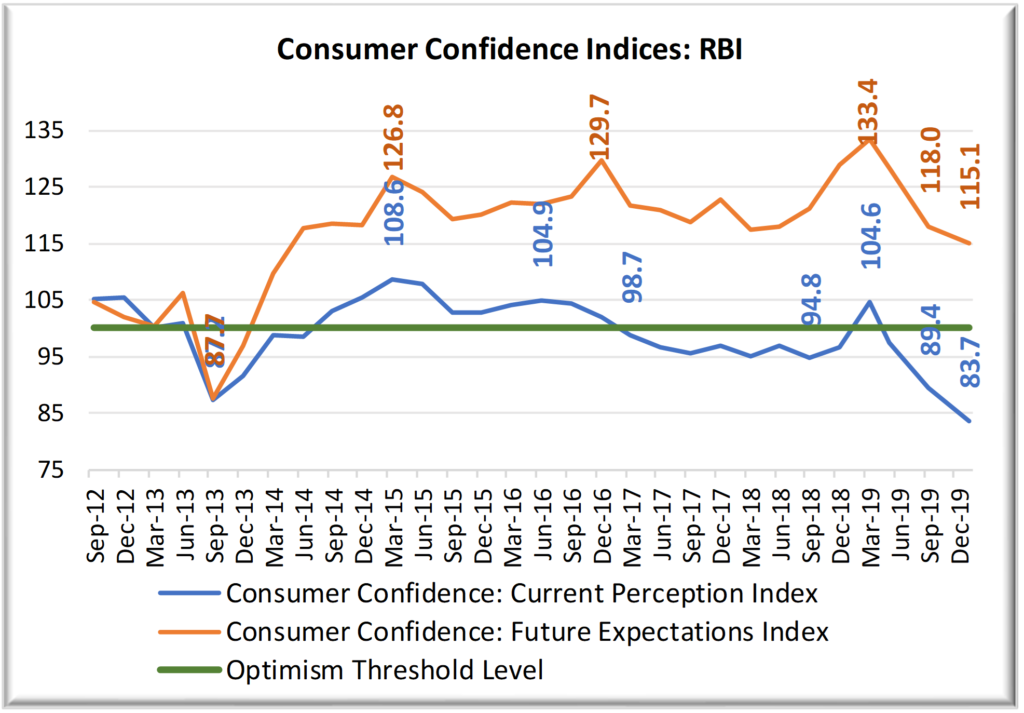
Source: Various Issues of RBI’s Consumer Confidence Survey of Major Cities
Charts 9 & 10 also point towards a significant downward shift in manufacturing industry’s assessment of their current and expected conditions.
It is, however, important to note that the Indian business does not see the situation to be as bad as the Indian consumer. In such a situation, we would have expected the Indian business to continue investing ahead of demand. But that has not been the case, as the capacity utilisation continues to be at historically low levels (Chart 11).
Chart 9: A Significant Downward Shift in Assessment of Current Business Conditions
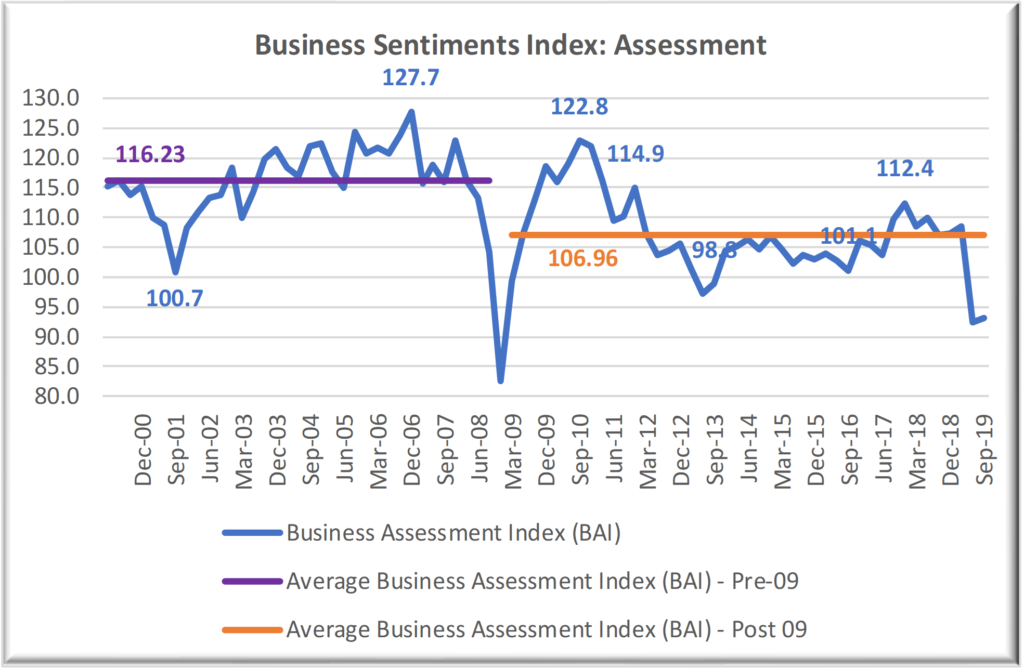 Source: Various Issues of RBI’s Industrial Outlook Survey of Manufacturing
Chart 10: A Significant Downward Shift in Assessment of Current Business Conditions, with the recent level being lower than what it was in Q4, 2001-02, though not as bad as Q1, 2009-10.
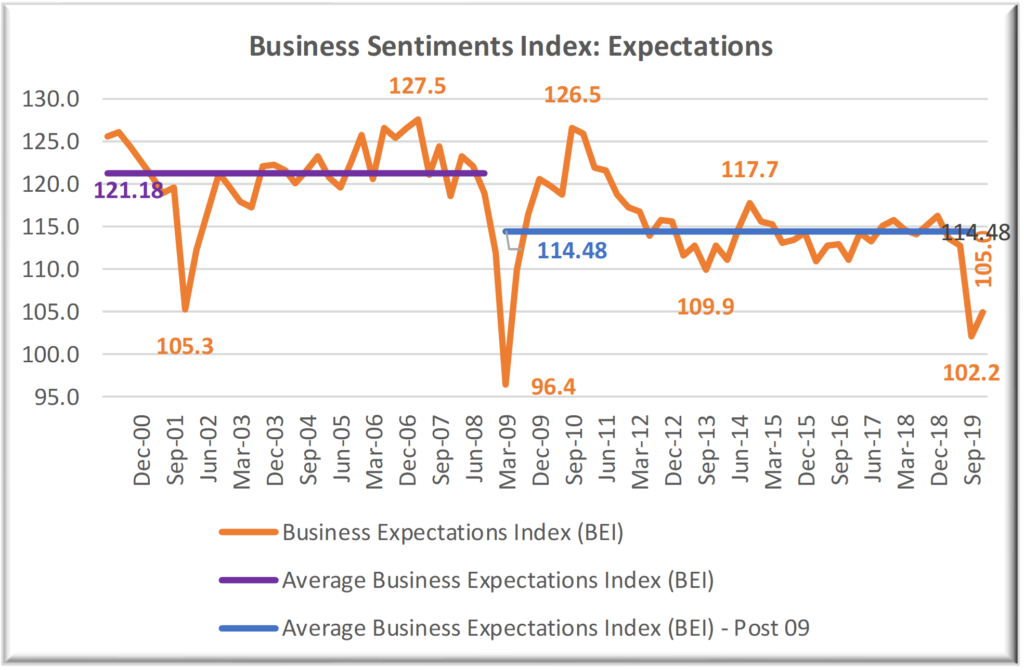
Source: Various Issues of RBI’s Industrial Outlook Survey of Manufacturing
We also observe (Chart 11) that the level of manufacturing capacity utilisation has been consistently low and has fallen very sharply during the last two quarters. At this stage, growth in industrial production is less than half of the rate achieved during the pre-GFC period.
Chart 11: Declining Manufacturing Capacity Utilisation[21]
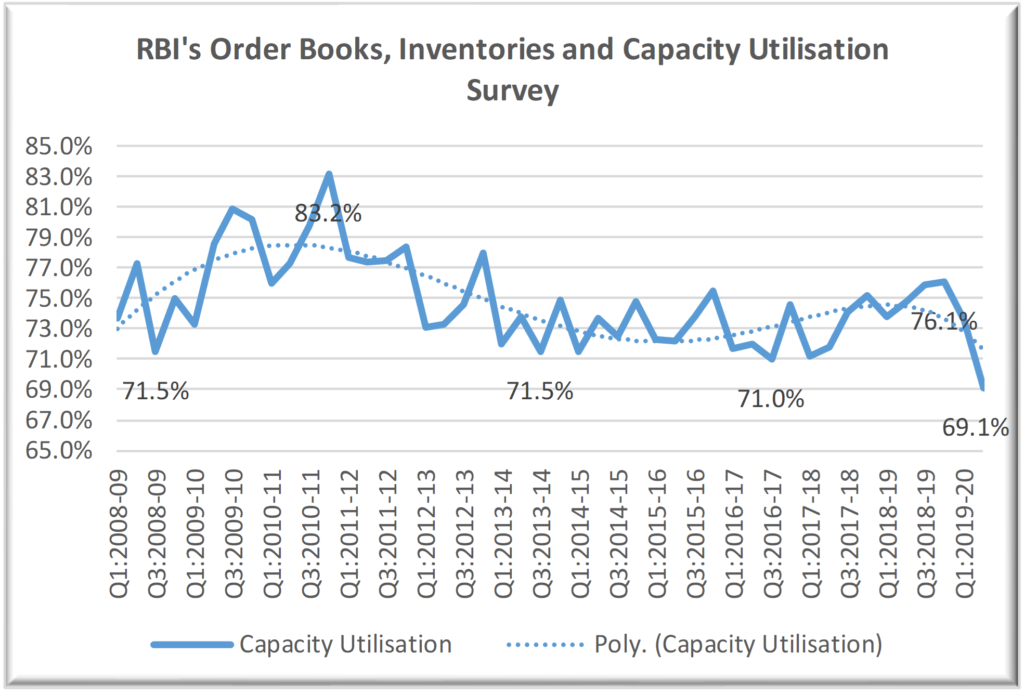
Source: Various Issues of RBI’s OBICUS Survey of Manufacturing
Chart 12: Growth in Manufacturing and Mining Activity
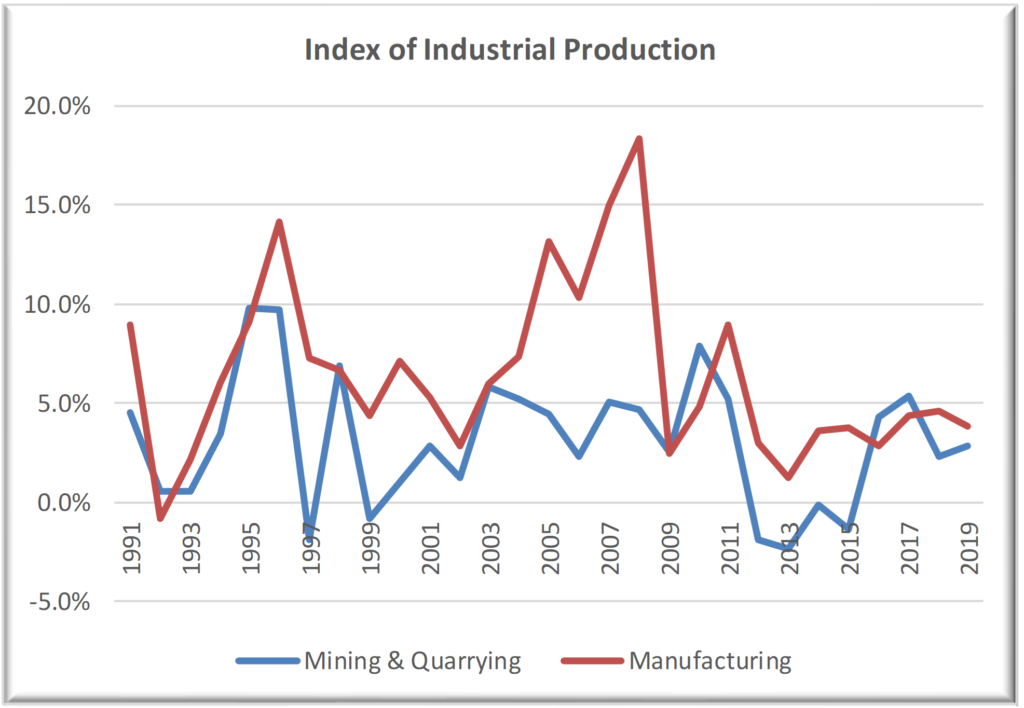
Source: Handbook of Statistics on Indian Economy, 2020-21
Go-Go years of investment and credit-led growth have also left the banking system stranded with a large amount of non-performing loans. The Indian banking system has been the main source of risk-capital for the Indian industry, as the level of fresh equity raised through financial market has always been low. As mentioned earlier, an average Indian households is not an equity investor.
Chart 13: Spiraling NPAs, that would go up once the regulatory forbearance steps introduced during the pandemic are withdrawn
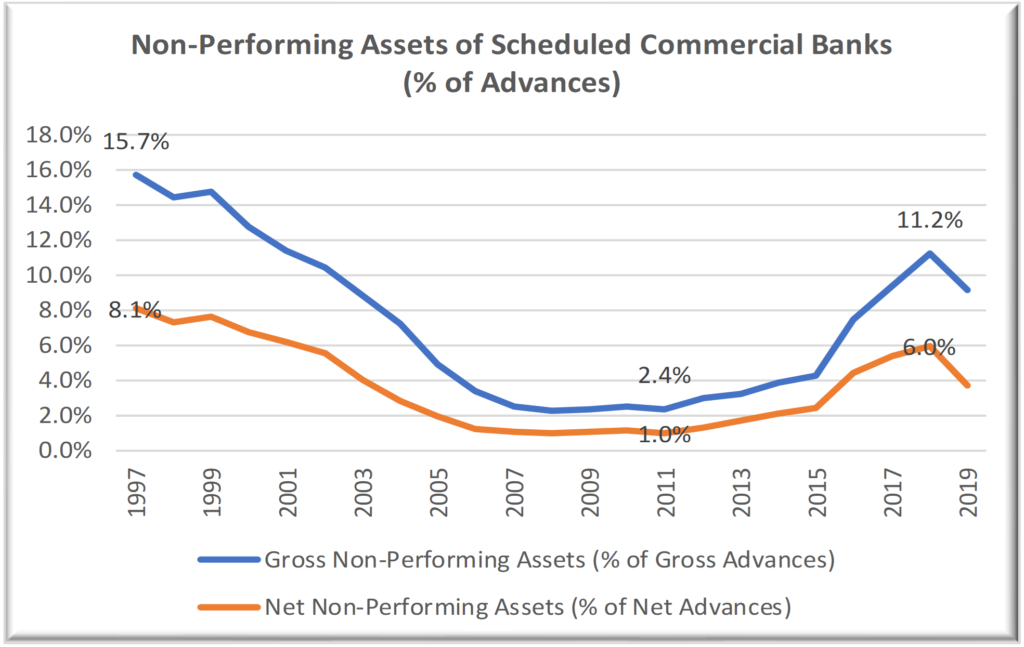
Source: Gross and Net NPAs of Scheduled Commercial Banks, DBIE, RBI
It is not only that the capital formation cycle has collapsed, but the savings’ rate too has fallen, limiting the availability of household savings for the banking system. At the same time, the central government, as the owner, has been reluctant to provide the required risk-capital to the Indian public sector banks. Consequently, the public sector banks, who finance almost all segments, have not been able to take risk and provide growth capital for the Indian economy.
Chart 14: Declining Household Savings Rates, but increasing Corporate Savings, implying improved margins for business
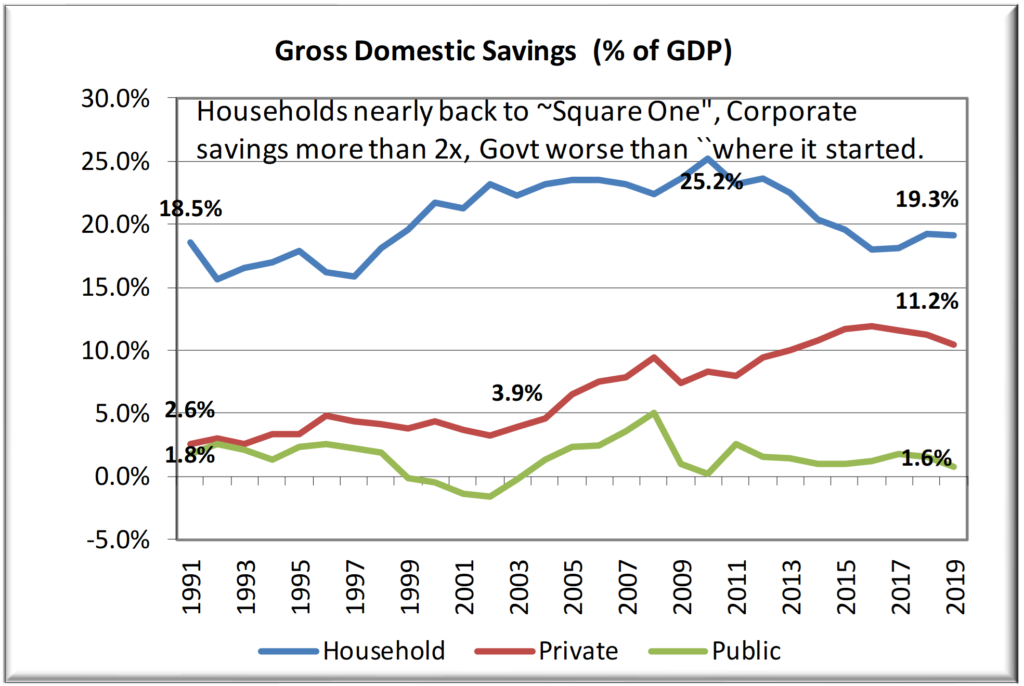
Source: Sector-wise Domestic Savings, RBI’s DBIE
Chart 15: Shrinking Household Saving Levels reflect in lower availability of funds with the Banking System and Stagnating Household Wealth
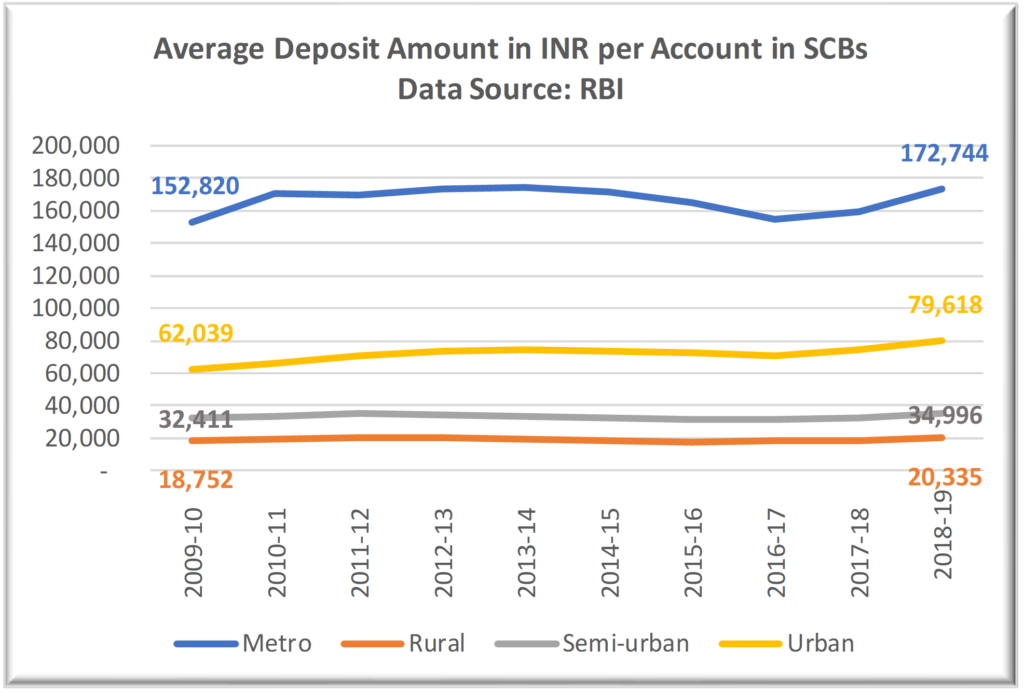
Source: Bank Deposits of SCBs, RBI’s DBIE.
In summary, we identify the following to be the challenges facing the Indian economy:
- Rate of economic growth, consumption as well as investment, has been declining and the rate of growth in investment has nearly collapsed during the quarter ending December 2019.
- Consumer’s assessment of current situation has been in the pessimism zone since March 2017, except for a blip during March 2019.
- Business’ assessment of current situation has fallen into pessimism zone for the first time since September 2013.
- A positive sign, at this stage, is that consumers and businesses continue to be optimistic about their future, though the level of optimism is lower than that in the past.
- Capacity utilisation across sectors continues to be low, implying that the demand for manufacturing investment will come back only if consumer and business assessment of current and expected situation gets sharply better and stays at a higher level at least for a couple of years.
- Banking system is struggling as the level of non-performing assets continues to be high, particularly having risen significantly during the last few years. However, it is not as high as it was during the late 90s.
- Indian household saving rate has fallen significantly and the average per account savings with the banking system has been nearly stagnant for the last nine years.
- As mentioned earlier, the Indian government has introduced many changes (demonetisation, GST, RERA, IBC, etc.) with the intention of creating a better business environment. However, some of the changes have adversely impacted the business performance as well as the sentiment.
As the annual Economic Survey, along with the analysis of economic performance, outlines the road map for policy choices, we explore the premises that the Survey has outlined for the policy makers during the last couple of years. We also ask ourselves if the Survey’s premises are grounded in India’s reality.
Recent Economic Surveys: Do they identify the policy premises that are grounded in India’s Reality?
Economic survey 2018-19 argued for investment to be the key driver for helping the Indian economy “into a self-sustaining virtuous cycle.” The Chief Economic Advisor described the Survey to be a “blueprint for fulfilling the vision of #Economy@5trillion” and of “tactical devices required to navigate an uncertain world in constant disequilibrium.”
Specifically, the Survey argued for private investment to be the key driver of growth, as highlighted by the title of the first chapter itself – Shifting Gears: Private Investment as the Key Driver of Growth, Jobs, Exports and Demand. The Survey views the economy to be in “a constant state of disequilibrium as captured by a virtuous or a vicious cycle”. The analytical material that the Survey uses is a series of linear relationships among per capita income, gross capital formation, savings, exports, etc., even when it is obvious that the relationships are deeply non-linear and cyclical.
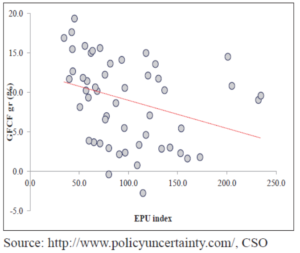
The Survey does recognise the problem of risk and uncertainty, but does that by using a limited, narrow perspective. Specifically, it has devoted a complete chapter (Chapter 6) to the problem of economic policy uncertainty and provides evidence that the economic policy uncertainty has been low since May 2014. Chapter 6 also discusses the relationship between policy uncertainty and growth in investment. Once more, it presents a simplistic view of the relationship by drawing a best fit linear line (Figure below), though the visual review itself tells us that it is anything but linear.
Superimposing linearity on naturally non-linear relationships contributes to making choices that are grounded in orthodoxy of our beliefs rather than the context.
Chart 16: Investment Growth and Economic Policy Uncertainty Index (Cited in Economic Survey 2018-19)
At the same time, the Survey refers just twice to economic uncertainty that nearly two-thirds of India faces – uncertainty caused by variability of rainfall during the monsoon season. One of these two references is to absolve the policy makers of responsibility to do something to deal with this uncertainty. To quote,
“For instance, while the monsoon impacts economic activity, policy makers have absolutely no control over it”.
Volume II referring, just once to monsoon, mentions the following:
“The extent of recovery in farm sector and farm prices will decide the push to rural consumption, which is also dependent on the situation of monsoon.”
It is indeed very surprising that the Survey wishes away the problem of economic uncertainty that impacts two-thirds of India, by dismissing it as not controllable. While the uncertainty, by definition, particularly the one caused by natural events, is not controllable, the State has the responsibility to ensure that the adverse impact of such uncertainty is minimised, especially for the most vulnerable sections of the population (households and small businesses). While the short run solution is in compensating people for their losses, the long run solution is to help people accumulate risk capital by raising their level of earnings and lowering the level of earnings-volatility.
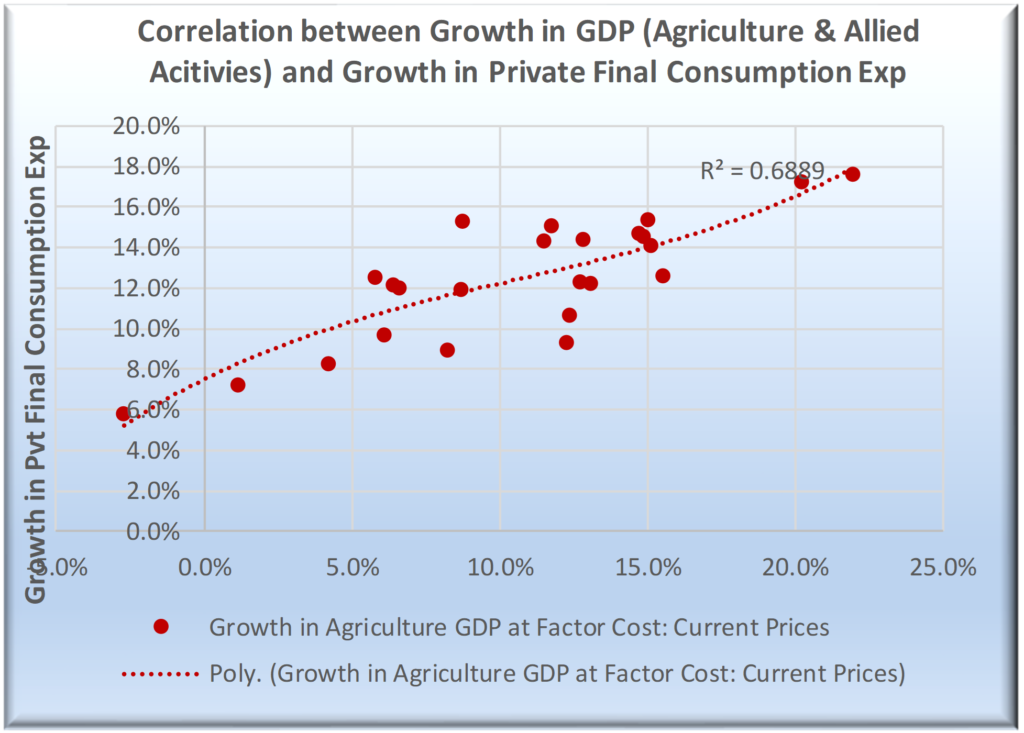
It is particularly important that we find these solutions on priority, as we observe a high degree of correlation between growth in agriculture GDP and the biggest component of GDP – private final consumption. Naturally, the correlation between agriculture GDP and aggregate GDP too is high.
The Economic Survey 2019-20 does refer to the impact of uncertainty around GDP growth on investment, but, again, without any significant discussion about the biggest source of uncertainty – uncertainty about the level and timing of rainfall.
Economic Survey 2020-21 recognises “the integral role of effective policy in charting the path to economic growth and social development.” The Survey goes to state,
“The upturn in the economy while avoiding a second wave of infections makes India a sui generis case in strategic policymaking, of being fearless to choose the road less travelled by; for in the end, that makes all the difference. India’s human-centric policy response to the pandemic, tailored to India’s unique vulnerabilities, demonstrated the power of upholding self-belief under immense uncertainty.”
Unfortunately, the second wave was not avoided. India experienced nearly 20 million new cases between February to June 2021 and 244,062 deaths.[22] We expect a policy making team to anticipate and help the country prepare itself for uncertainty. A premature celebration[23] can leave the society completely underprepared as was seen during the second wave – costing lives as well as livelihoods.
Such a gross neglect forces us to ask a couple of questions about the economic role of the State:
- Why does the policy discussion not consider uncertainty (monsoon performance) that nearly two-third of India faces?
- Why did the policy not consider the possibility of pandemic causing loss of life as well as livelihood?
4. Economic Role of State: A Night-Watchman or an Active Participant
While there has always been an agreement that the state has a role in economic development, there are significant disagreements about the nature of this role.
At one extreme is the “night-watchmen state” premise where the state “exists to maximise the economic freedom of private individuals whose socially productive activities, protected and promoted by the state, are not just permitted by government, but are in fact enabled by government, to flourish spontaneously. The political economy associated with this minimal state is called laissez-faire.” [24]
Such an economy is characterised by perfect competition, where “the ‘invisible hand’ of the market is able to determine the optimum allocation of a country’s resources. Together with this, it is assumed that the market is able to achieve optimal social welfare because, as individuals and firms maximize their own self- interest (profits), they will unintentionally maximize social welfare (through, inter alia, providing employment, and taxes to fund the provision of social services).” [25]
In this world view, the “government intervention in the economy is viewed as inefficient not only because of bureaucratic blockages, but also because of its tendency to distort market prices and cause misallocation of scarce economic resources. Therefore, in this view, there should be a “rollback” and a “retreat” of the state in economic affairs (Sentsho,2001).” [26]
That is, the state is expected to act only when the market fails.
Over the years, it has become clear that the markets do fail. Stiglitz (1986)[27], as quoted by Jason Brown[28] identified the following market failure situations:
- failures of competition, the existence of market power,
- the need for public goods, desirable goods and services that could not be produced profitably under free markets,
- externalities, costs, and benefits that are not reflected fully in market prices,
- incomplete markets, usually insurance and forward markets,
- information failures, including persuasive advertising,
- macroeconomic disequilibria, high “natural’ levels of unemployment,
- poverty and inequality, where the market outcome does not reflect society’s preferences, and
- merit goods, where individuals fail to act in accordance with the state’s view of their best interests.
At the current stage of development in India, there is enough evidence to suggest that the Indian economy is far from having the institutional framework required for night-watchman state.[29] [30] [31] [32]
During the 1950s and 60s, the public-choice theory research identified situations that were characterised as the government failure. Boettke and Leeson[33] list the “interventionist ‘cures’ that seemed worse than the market ‘illnesses’ they were designed to remedy – among them, the logic of special interest groups; short-sighted policy bias; regulatory capture; and the problem of bureaucracy.”
Boettke and Leeson further state, “Given the probability of state failure as described by public-choice theory – failure that threatened to produce a still worse state of affairs than that generated by imperfect market – the burden of proof fell on those who would ask the state to intervene in the economy beyond the ‘protective function’ of supporting private property rights and the ‘productive function’ of supplying essential public goods.”
Consequently, we have had new orthodoxy emerge, that of government failure. The reality, however, is that it is the context that defines our choices not one set of beliefs. Such a premise was very well articulated by John Maynard Keynes, as quoted by Boettke and Leeson.
“It is not a correct deduction from the principles of economics that enlightened self-interest always operates in the public interest. Nor is it true that self-interest generally is enlightened; more often individuals acting separately to promote their own ends are too ignorant or too weak to attain even these. Experience does not show that individuals, when they make up a social unit, are always less clear-sighted than when they act separately.”
It probably is one of the best insights that can guide our choices and encourages us to make choices, particularly public policy choices, without being burdened by an ideology.
Neither the Market nor the State is infallible. Therefore, context, not ideology, must govern choices.
As discussed earlier, India is still a country with one of the largest number of poor in the world, where growth has lost momentum, household savings are declining, we have excess capacity in many labour-intensive businesses which is resulting in the collapse of private sector investment, banks are stranded with a large amount of non-performing assets, industry and households lack risk capital, where consumers’ assessment of current situation has been in pessimist region for nearly three years, and the productivity growth too has been low.
In such a situation, the Economic Survey 2019-20 and 2020-21 had chosen to romanticise ‘wealth creation’ through “the Invisible Hand supported by the Hand of Trust” [34] and “power of upholding self-belief under immense uncertainty.”
Analytically, the Survey has once more chosen to feed orthodoxy through simplistic analysis. It uses linear relationships as an analytical frame for understanding a complex phenomenon. Wealth creation has been equated to growth in BSE Sensex, an index that just tracks equity performance of 30 large corporations, when less than 10% of India’s household savings are invested in capital market. It refers to Sensex 86 times in both the volumes. While it has 12 references to uncertainty, none refers to economic uncertainty that Indian households face.
In short, it does not help to romanticise a faith-based approach to economic development, particularly when we have no infallible way to deal with market or government failure. Being the night-watchman and waiting for the private sector to invest is not going to put the Indian economy back on growth path. We need to identify the sources of true uncertainty that an average Indian is faced with and help him or her raise their ability to deal with it.
5. Government Spending and Economic Growth: Wagner’s Law
Since the core policy premise is that economic growth helps raise standard of living, we need cats of all colours to catch mice.[35] We need households, business as well as the government to invest in the country’s ability to grow.
In this section, we examine the relationship between growth in GDP and public expenditure. While there is no consensus about economic role of the state, the government expenditure continues to be high globally irrespective of the stage of development of a country.
We find that government expenditure in developed countries continues to be high and/or is increasing even when the per capita income (in constant $2010) has continued to increase. The advanced economy governments have used fiscal policy instruments reasonably well to lower the probability of prolonged deep recession after COVID-19 impacted lives and livelihoods in these nations. Many of these countries have been running large budget deficits, with high level of government debt (e.g., the government debt in France and the USA is about 100% of GDP, the UK about 85% and Germany about 60%. It is ~240% of GDP in Japan) even before the pandemic. COVID-19 related spending has caused the deficits as well as debt to go up and both are expected to remain high for many more years.
Chart 17 shows that the General Government Expenditure (including various levels of government) in all the big economies is at a significantly higher level than what it was in 1990.
Chart 17 (Globally the government expenditure has been high and is increasing in many countries)
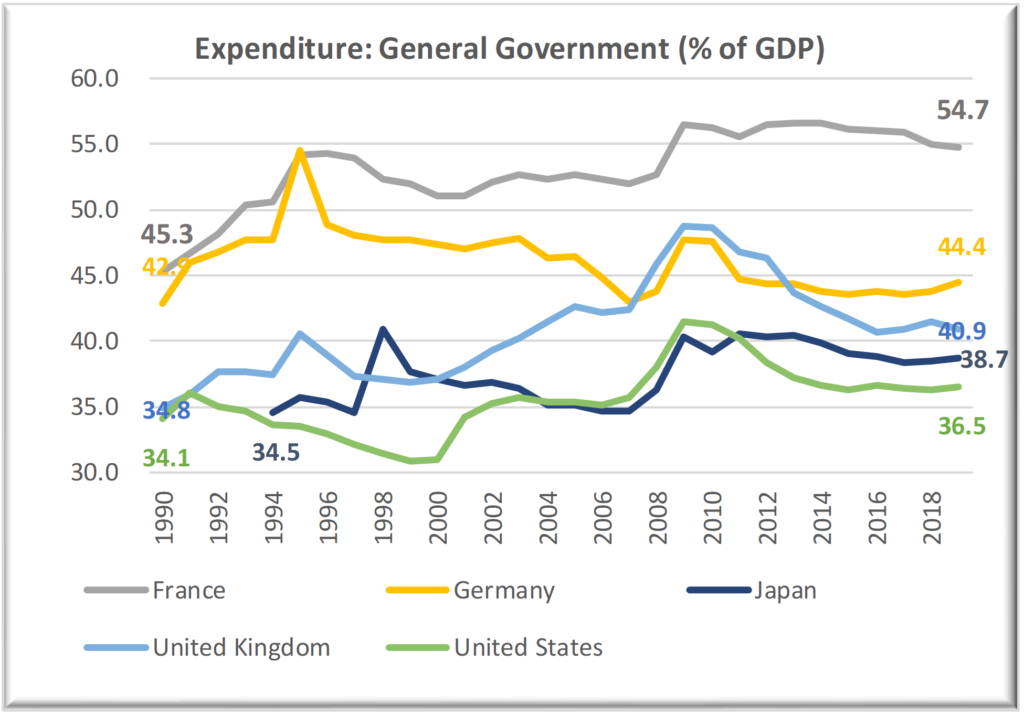
Source: IMF’s Government Finance Data Base
Increasing government spending with increasing per capita income is a phenomenon that has been explained by Wagner’s Law. Wagner, a 19th century German economist, postulated that the public expenditure rises with an increase in income, with the long-term elasticity being greater than one, i.e., we expect the public expenditure (% of GDP) to go up.
Serena Lamartina and Andrea Zaghini[36] suggest “the existence of a long-run positive correlation between public spending and GDP growth in 23 OECD advanced economies…The hypothesis that the long-run elasticity is equal across countries turned out to be viable for our sample, thus suggesting a common development among the 23 countries and the widespread validity of the Wagner’s law…In the spirit of the law we also found that the long-run elasticity is usually higher in countries with lower per-capita GDP, suggesting that the catching-up period was characterized by a stronger development of government activities with respect to economies in a more advanced state of development.”
The state’s ability to sustain increased government expenditure is function of its ability to raise tax and non-tax resources and manage deficits.
The question then is:
Why is the Indian state shying away from playing the role that the state across the world is expected to play?
In rest of the paper, we examine the public spending pattern in India and examine if the fears that are holding back the Indian state from playing the role it is expected to play are real.
6. Economic Uncertainty and the Level of Government Expenditure in India
The state (provincial) and the central governments have spent, on an average, an amount equivalent to 26.76% of the GDP (measured at current market prices) on development and the non-development expenditure. While it was at its lowest level (24.2%) during 1997, it reached a peak of 28.6% of GDP during 2010. Since reaching its peak, the expenditure level has fallen to 26.4% during 2018. It is interesting to note that the expenditure (% of GDP) during 2018 is lower than the average since 1996. Given the level of GDP in 2018, a one percent decrease in government expenditure implies a reduction in spending of about USD 24 billion.
Chart 18 (50% of time, the government expenditure has been above the long-term average)
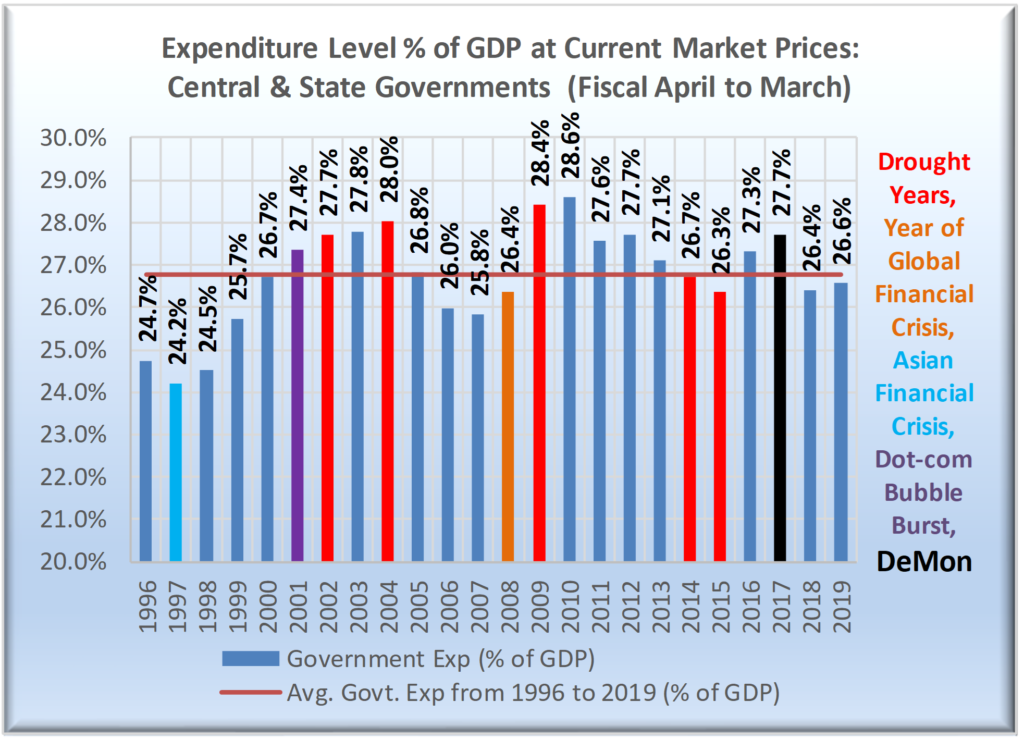
Source: Central and State Government Finance, RBI’s DBIE
We have had intriguing responses by the government to drought. For example, the government responded to drought during monsoon season 2014 by cutting down aggregate expenditure by 0.4% during fiscal year 2014-15 (down from 26.7% in Fiscal 2014 to 26.3% in Fiscal 2015). We observe a one-percent increase during the Fiscal 2016, with failure of monsoon season 2015 too. We saw another year of increase in expenditure level by 0.4% (Fiscal 2017), which was followed by a reduction of 1.3% in aggregate expenditure during the Fiscal year 2018. Bringing the 2018 expenditure level down to 26.4% of GDP, below the long-term average.
Government responded very similarly to droughts during monsoon seasons 2002 and 2004, with only a marginal increase in expenditure during fiscal years 2003 and 2004, followed by a sharp reduction during 2005.
We did have the government loosen its purse strings during the global financial crisis. We saw a significant increase in aggregate expenditure. It may also be mentioned that the monsoon season 2009 happened to be a drought year too. Increased expenditure was meant to reduce the adverse impact of spiking of global commodity prices on household consumption. It did provide the needed relief, but was needed to be supported through increased resource mobilisation elsewhere – that did not happen.
The global commodity prices increased by 31.6% and 23.8% during 2009 and 2010, respectively (Chart 26). The rain-deficit during 2009 was at 21.8%, one of the worst rain-deficits in independent India. The government responded by raising its spending by over 20% for each of the two years. It not only increased the development expenditure; it also increased the subsidies on petroleum and food products – nearly doubling them from INR 709.26 billion (1.42% of GDP) in 2008 to INR 1,413.51 billion (2.18% of GDP) during 2010 (Chart 19).
Chart 19 (Subsidies have been on decline, except for Interest)
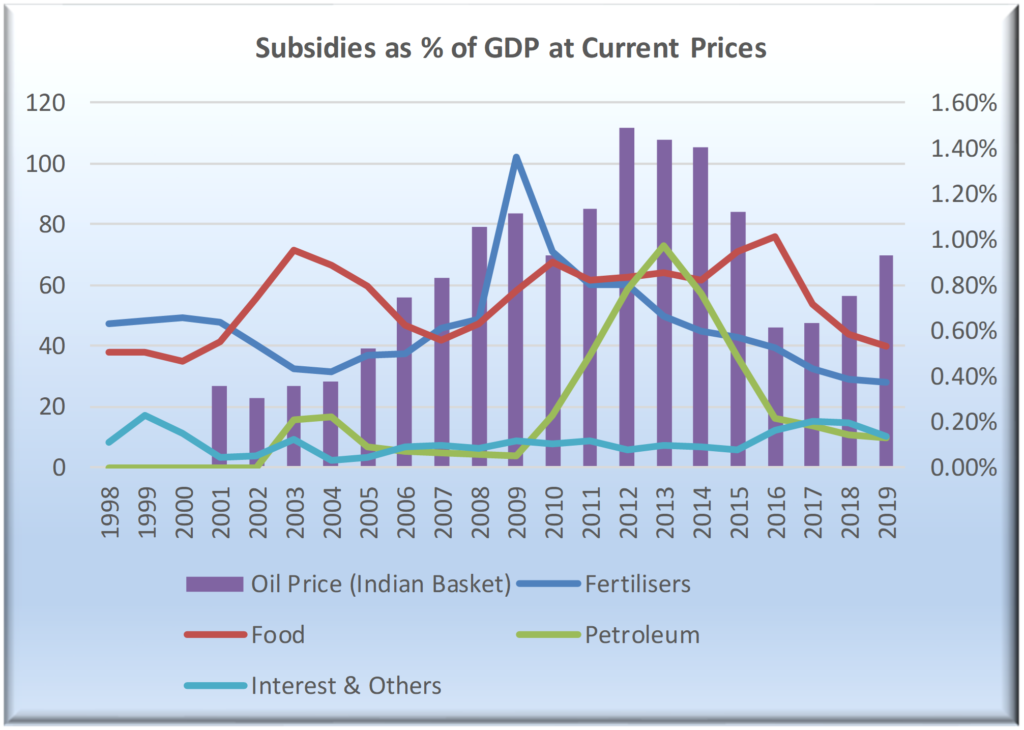
Source: Various Budget Documents, Government of India
In summary, the behaviour of government expenditure in India has not been consistent with Wagner’s law – the level of expenditure has not been growing with growth in GDP. In fact, the government has not been raising its spending, even when the economy has experienced high degree of uncertainty. It has been closer to its long-term average of 26.76% in most years, except for a few years after the global financial crisis.
7. Growth in Agriculture and its relationship with Economic Growth in India
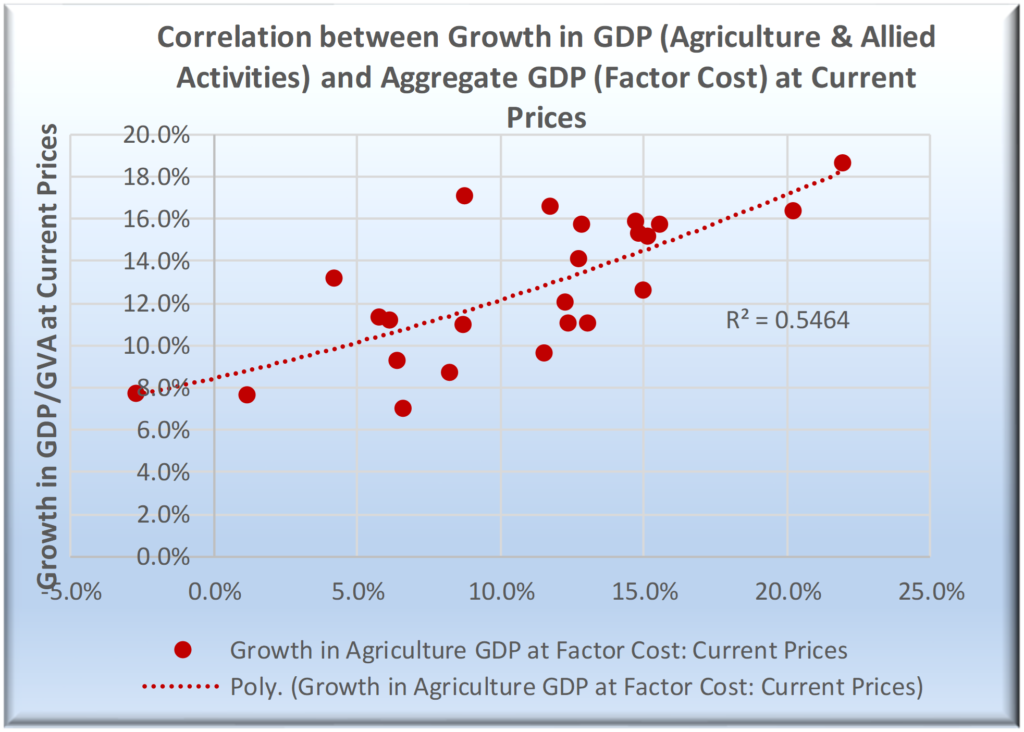
The question, therefore, is why would a government, in a largely agriculture dependent country, reduce its spend or not increase it sufficiently even during or after a drought year? The choice of reduction in expenditure (during the fiscal 2018) after two consecutive years of drought during 2014 and 2015 and the policy mishaps (demonetisation in 2016 and tardy implementation of GST in 2017) is even more intriguing. Some economists/analysts have been making the argument that India has transitioned from being an agriculture dependent economy (or that agriculture’s contribution to GDP is low) and therefore it can grow without agriculture being supported by the government. Let us look at the validity of that argument by estimating the correlation between growth in agricultural GDP and the aggregate GDP at Factor Cost and growth in agricultural GDP and private final consumption expenditure, both at current basic prices (Chart 20).
We would argue that the correlation level of 0.5464 (between agricultural GDP and aggregate GDP Factor Cost) and 0.6889 (between agricultural GDP and private consumption) is sufficiently high to state with confidence that the Indian economy is still agriculture dependent. The ADB study referred to earlier also observes that agriculture forms the Indian economy’s backbone. [37]
Chart 20 (High positive correlation between Growth in Agriculture GDP and Aggregate GDP)
Source: Components of GDP, RBI’s DBIE
Chart 21 (High positive correlation between Agriculture GDP and Private Final Consumption Expenditure)
Source: Components of GDP, RBI’s DBIE
Given that India’s growth is dependent on agriculture and agriculture faces significant uncertainty (largely on account of natural conditions, we see every reason for the state to invest in the economy consistently to support the economy, particularly the agriculture dependent households.
An argument for cutting back on government expenditure, often put forth by the believers of ‘minimum government’ premise, is the fear of inflation following or in anticipation of high fiscal deficit (or expenditure gap). Let us now examine if there is indeed a strong case for worrying about inflation.
8. Government Expenditure, Deficits, and Inflation in India
As a first step, we review the relationship between inflation and growth in government expenditure. Chart 22 below estimates the correlation to be at 0.2797.
Chart 22 (Weak positive correlation between growth in government expenditure and inflation)
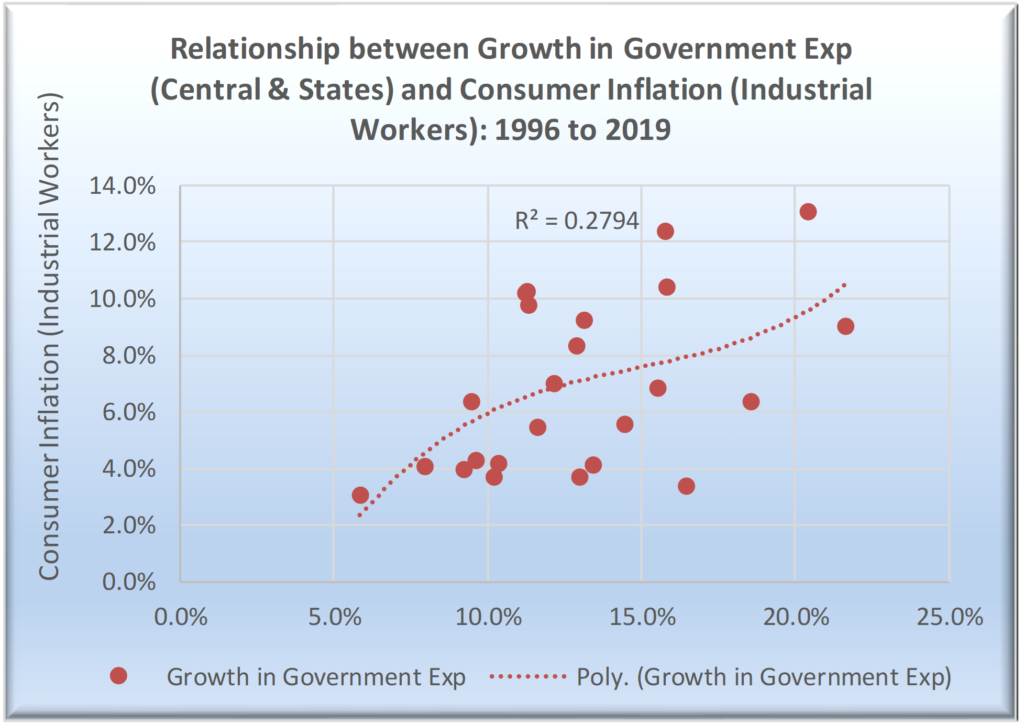
Source: Central and State Government Finance and Prices & Wages, RBI’s DBIE.
We also evaluate the relationship between expenditure gap or deficit (Revenues – Expenditure) and inflation to see if the level of deficit has much to do with inflation. Chart 23 below does not suggest that either. In fact, we observe that in many years, the inflation rate has been low even when the deficit rates are high, e.g., 2000 to 2004 and 2016 to 2018. Also, we have years when deficit is declining but inflation is increasing, e.g., 2004 to 2009.
Chart 23 (Level of Government Deficit and Inflation)
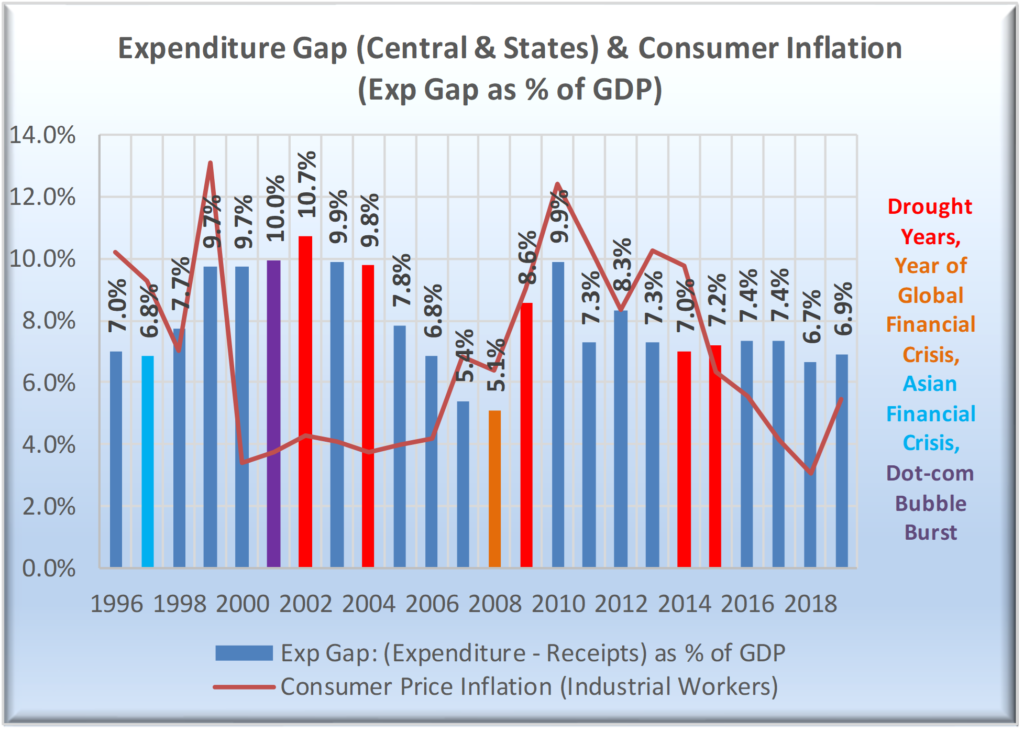
Source: Central and State Government Finance and Prices & Wages, RBI’s DBIE.
Similarly, Chart 24 below also suggests that the relationship between the level of deficit and inflation is at best week – a correlation of 0.05.
Chart 24 (Government Deficit and Inflation are not necessarily correlated)
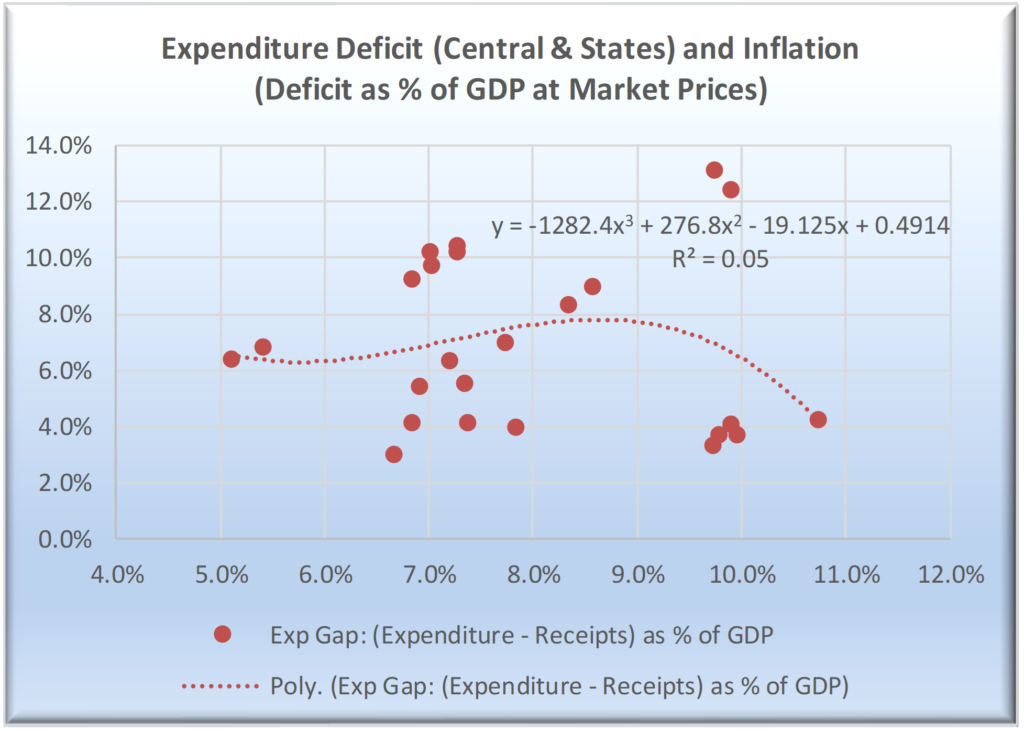
Source: Central and State Government Finance and Prices & Wages, RBI’s DBIE.
Government Deficit and Inflation: What causes inflation if the government deficits do not?
Given the stage of development, India is expected to have relatively high inflation. During the last two decades, it has been in double digits for 5 years (of the 23-year study period) and above the average rate of 6.7% for another 5 years, making it 10 years of higher-than-average inflation (Chart 25).
It may be noted that 6 of these 10 years (of above average inflation) have been from 2009 to 2014. It was also a period of high depreciation in the value of the Indian rupee (INR), which fell from 45.99 to 60.5 to a USD.
Chart 25 (Historically India has always experienced relatively high inflation)
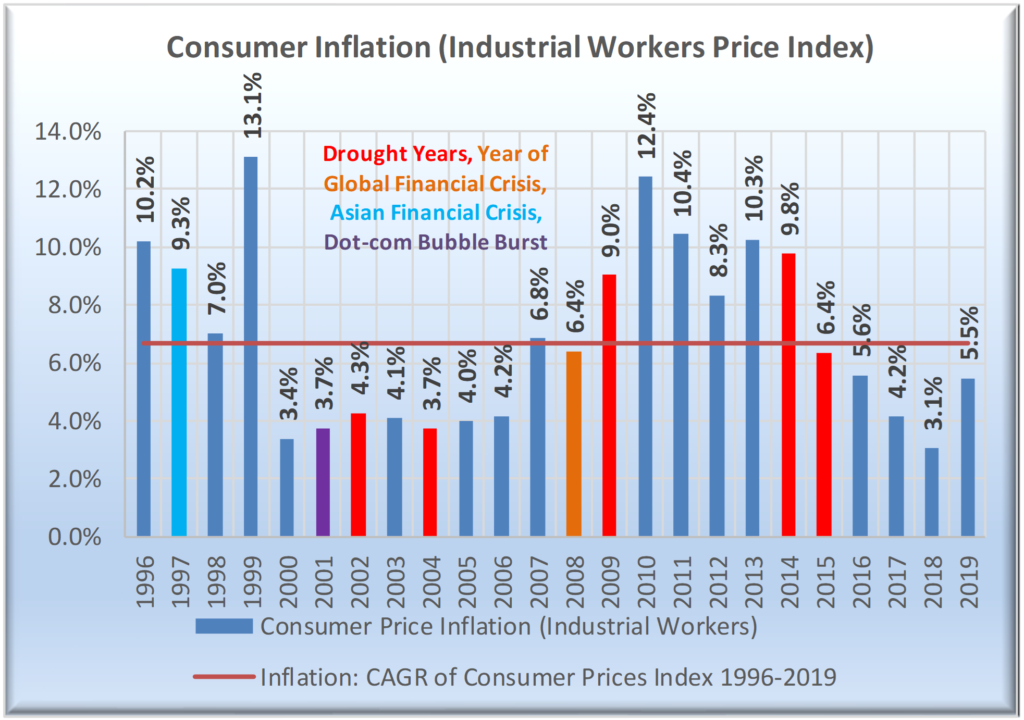
Source: Prices & Wages, RBI’s DBIE.
It may be pointed out here that the first decade of this century was characterised by exceptionally high commodity prices, including that of crude. Chart 26 below provides information about global commodity prices since 1995. Exceptionally high inflation is not really deficit led but is probably caused by unprecedented increase in global commodity prices. Commodity price inflation continued even after the global financial crisis – a crisis that had led to a near collapse of demand for commodities and that of economic activity itself.
In other words, we were living in a world where the growth rates were slowing down (or collapsing) but the commodity prices were going up. Commodity prices did collapse during 2008 but came back strongly almost immediately.
Chart 26 (Post GFC Inflation was a global phenomenon, largely caused by increased commodity price inflation)
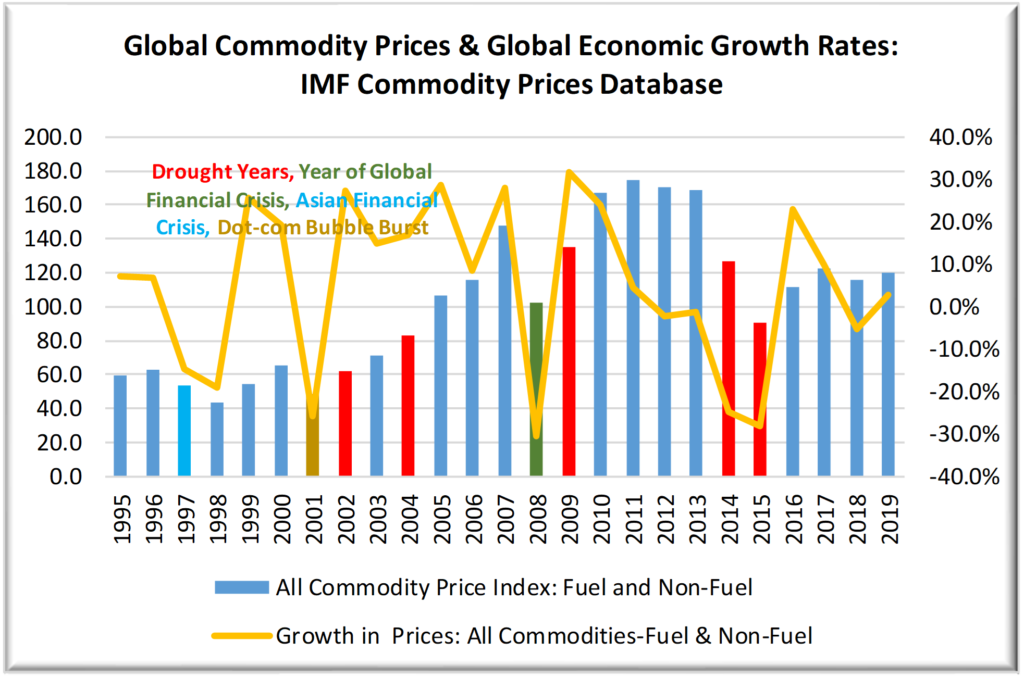
Source: IMF’s Commodity Prices Data Base.
Another factor that impacts inflation and/or volatility in prices is currency prices (exchange rate), particularly so in an economy that runs a large trade or current account deficit unless, of course, it has a large capital surplus (i.e., the country is an attractive investment destination). India runs very large trade deficit and a high current account deficit in most years, but has been an attractive destination for financial capital in some years.
Chart 27 below provides information about variation in exchange rates and its relationship with inflation in India. It is not surprising to find a positive correlation between variations in exchange rates and inflation as India has increasingly become dependent on imports for feeding its consumption and investment growth.
Chart 27 (Inflation and INR Depreciation are positively correlated)
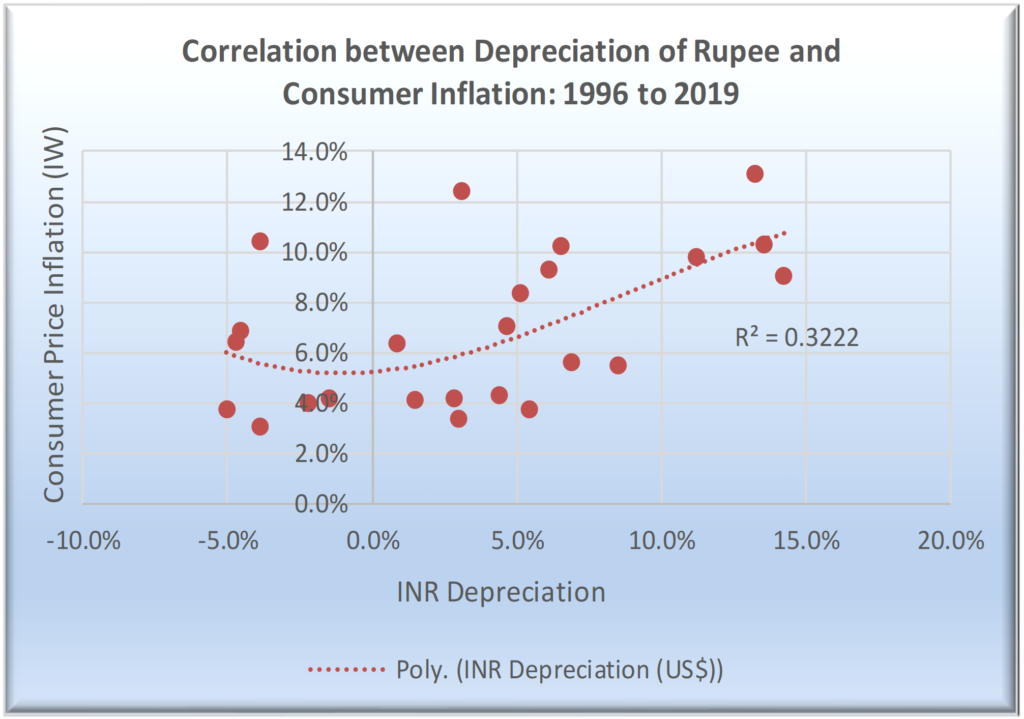 Source: Financial Market and Prices & Wages, RBI’s DBIE.
One of the reasons for not discovering very high correlation between variation in INR value and inflation is that INR value is being actively managed by the RBI. RBI is forced to intervene in the foreign exchange market, as the capital flows by foreign portfolio investors often cause significant exchange rate volatility.
Another factor that has added complexity to dynamics of inflationary pressures was the surge in gold prices and the quantity of gold imports, putting pressure on exchange rate and resulting in speculative investment in an unproductive asset – all of that in a low middle-income country that needs large investment in basic infrastructure and has a large population of the poor (Chart 28). Though the gold imports, have come down from their peak in 2010, they still continue to be at an elevated level – levels that are similar to early 2000s.
Chart 28 (Gold demand has been on decline and as has been the price)
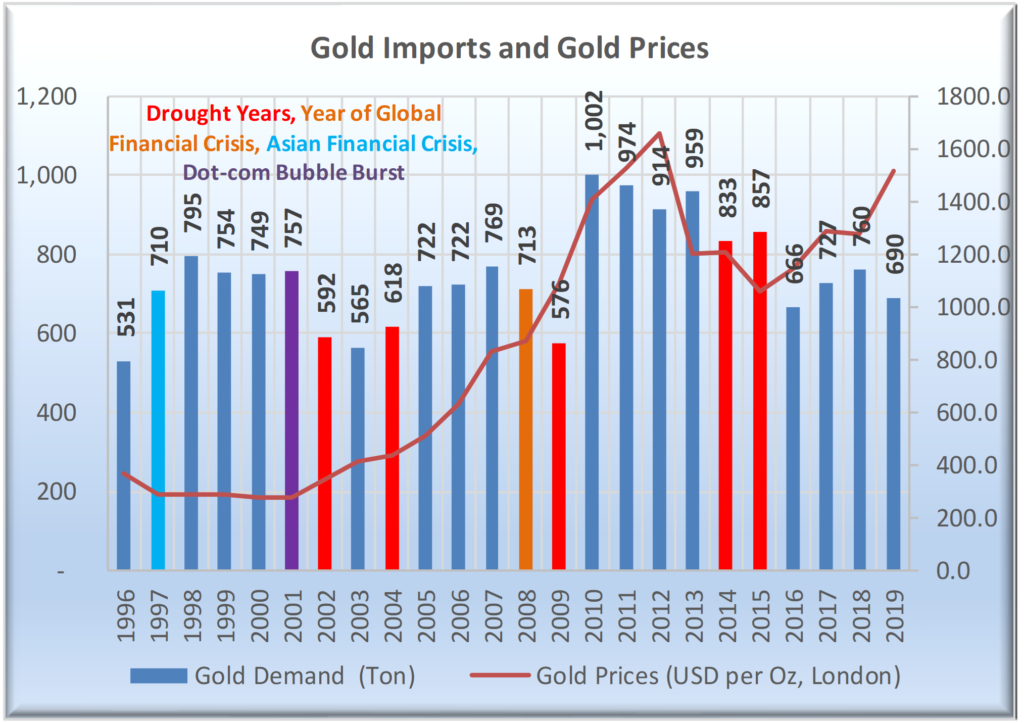
Source: Prices & Wages, RBI’s DBIE.
In summary, we conclude that the level of inflation is not always being driven by the level of deficit or the growth in government expenditure. It is also being driven by the level of global commodity prices and exchange rate for the Indian rupee.
9. Nature of Resource Mobilisation and its impact on India’s ability to invest for growth
As mentioned earlier, Wagner’s law postulates a positive relationship between the level of government expenditure and economic growth. Our analysis in Chart 18 suggested that the level of government expenditure in India has not been consistent with Wagner’s law. It has just been closely tracking its long-term average of 26.76%.
One of the reasons for the expenditure to be low is that the level of tax revenue has become nearly stagnant, and the government has focused on fiscal consolidation. One of the reasons for stagnancy in revenue is that the government has provided both direct and indirect tax concessions to business and individuals to support growth, first post the global financial crisis and more recently during 2019[38] when the economy had already lost its growth momentum.
Chart 29 (Tax Revenue for Central and State Government is yet to reach the peak experienced during 2008 and the government deficit is higher by 1.8%)
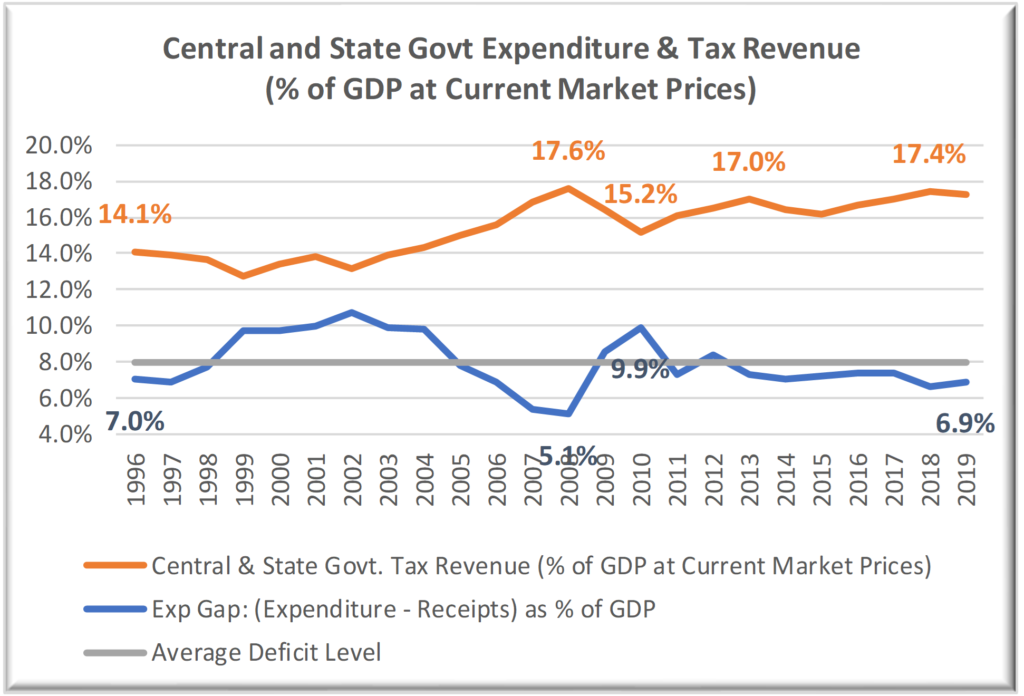
Source: Central and State Government Finance, RBI’s DBIE.
The long-term average deficit level is 7.9%. Since 2013, the deficit level has been below this long-term average. A low deficit level combined a stagnant tax to GDP ratio ends up compromising an economy’s ability to invest. It is possible that the tax breaks provided post the global financial crisis have helped save the economy from collapse during the crisis period. But we would not know that for certain, unless, of course, we investigate the relationship between reduction in tax rates, consumption, and investment decisions in the economy. Such an investigation will require us to estimate the level of economic activity with and without these concessions, which is not an easy task.
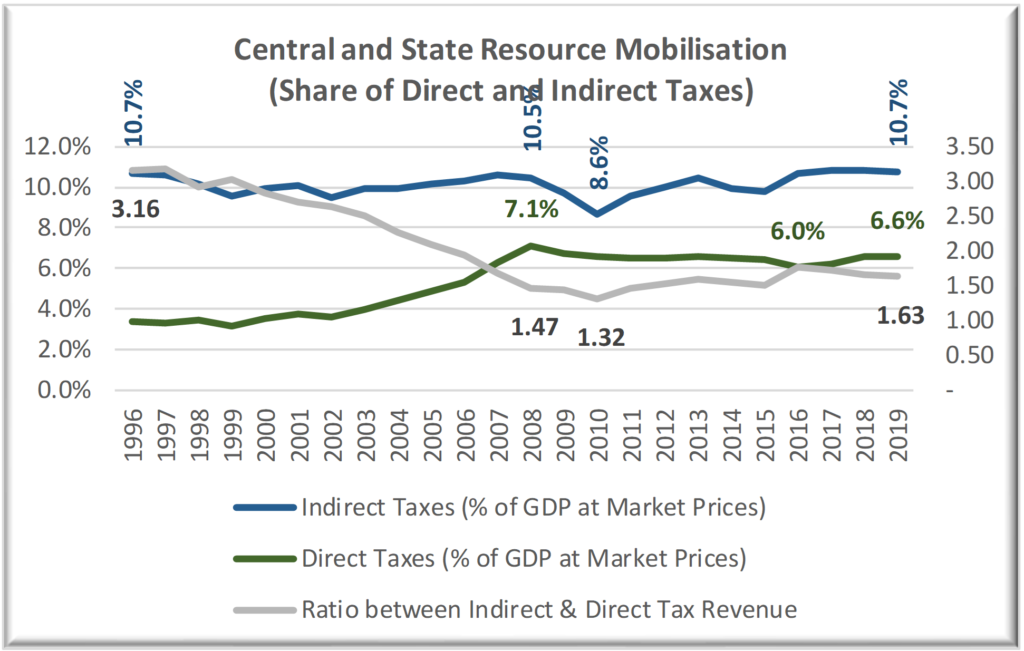
Yet another challenge comes from the changing nature of revenue mobilisation. Indirect taxes, considered regressive by design, continue to contribute an increasing share in total tax revenue. Consequently, the ratio of indirect to direct taxes has gone up from 1.32 in 2010 to 1.63 in 2019. (Chart 30). The government has lowered the corporate tax rate during December 2019 and raised indirect tax rates on petrol and diesel during 2021 – making the tax regime even more regressive.
Chart 30 (Indirect Taxes, considered regressive by design, continue to be high)
 Source: Central and State Government Finance, RBI’s DBIE.
In short, natural events like drought, global financial crisis, and the resource mobilisation policy have resulted in the level of revenue being stagnant. At the same time, an average Indian household, particularly low- and middle-income households, are having to share an increasing burden in form of indirect taxes. Even in these circumstances, the government, in its wisdom, has chosen to focus on fiscal consolidation as its primary concern. Consequently, we have a situation where the economy has lost its ability to invest for growth, take risk and deal of uncertainty.
Conclusion
Economic theory, empirical evidence and our analysis suggests that the government expenditure contributes to economic growth, and we expect the level of expenditure to go up with an increase in per capita income. In addition, deficits do not always cause inflation or crowd out private investment, and sustainability of the government debt is function of its ability to raise resources.
India is a low value-adding economy with limited risk capital, and it is, therefore, important the Indian state lets its choices be guided by India’s economic and social context, which requires it to increase its investment in helping Indian households and business (specifically MSMEs) build their ability to grow, and not by economic orthodoxy.
We need a long-term vision and a set of national programmes that help households and small businesses increase the pace of capital accumulation so that they are better prepared for uncertainty caused by economic as well as natural events and are able to invest across cycles. Incentives for large corporations must get aligned with their contribution to improving labour and capital productivity and value-creation through innovation – investments that enhance a society’s ability to grow consistently.
Acknowledgement
My thinking about the role of state and the work in this paper has benefitted from insightful conversations with Dr Anujayesh Krishna, Dr Biksham Gujja, Dr C Jaya Kumar, Dr N Krishna Reddy, Dr Y R K Reddy, Mr Amitabh Doss, Mr Amitabh Pande, Mr Anand Pandey, Mr Anish Mathew, Mr Anmol Sethy, Mr Anthony Jayaranjan, Mr Azfar Hussain, Mr Bhavesh Shah, Mr Brij Chandiramani, Ms. Chitra Sood, Mr D Durga Prasad, Mr Jagdeep Kochar, Mr Keyur Shah, Mr Marc Alderding, Mr M C Srikanth, Mr Narendra Bellare, Mr Niraj Jain, Mr Nirupam Sahay, Mr Pawan Bindal, Mr Rajasekharan N, Mr Ram Mohan, Mr I Ramakrishna, Mr S Siva Kumar, Mr Seetaram Motupalli, Dr Shekhar Damle, Mr Sumit Saurav, Mr Yogi Sriram, Ms. Gira Sardesai, Ms. Katherine Hadda, Ms. Manju Ghodke, Mr Ramesh Menon, Mr Yawar Baig, Prof Alex Thomas, Prof Banikanta Mishra, Prof P Venugopal, Prof Ravee Chittoor, Prof Ravi Anshuman, Prof S Ramnarayan and Prof V Jaikumar and many other friends and colleagues.
I have also benefitted from my classroom conversations, particularly during the Global Financial Crisis period, when the anxiety levels among business leaders and managers about the state of global and the Indian economy were high.
Data analysis is supported by Jonathan Alex and Nishant Dash, who have been the members of IASCC’s research team. I am indeed grateful.
References
[1] The first draft of this paper was meant to be a background paper for a round table on Economic Role of the State and was prepared during January/February 2020 before the economic and social impact of the pandemic started becoming visible.
We have not updated the information charts in the current version to ensure that we do not lose sight of the pre-pandemic context, as our analysis is meant to outline the need for redefining the state’s role under normal circumstances. The need for the state to play an active role is now even more obvious than in the pre-pandemic world. Given that the economy is recovering from a near collapse and the recovery has been uneven, millions of households and small-medium businesses have lost their ability to take risk and invest in their future. The footnotes do carry additional information about India’s economic during the last two years, wherever required.
[2] IMF to Nirmala Sitharaman: India needs these reforms urgently; economy weaker than projected earlier – The Financial Express, last accessed on January 26, 2022.
[3] The Economic Survey 2020-21 did recognise the need for a debate about raising debt to support growth. But it came with a qualification: “The same phenomenon of a negative IRGD in India – not due to lower interest rates but much higher growth rates – must prompt a debate on the saliency of fiscal policy, especially during growth slowdowns and economic crises”.
[4] Even when India is struggling to cope up with the after effects of pandemic, it continues to receive advice to focus on fiscal discipline by influential public intellectuals, e.g., Fiscal discipline, digital economy must be the policy focus: Ruchir Sharma – The Hindu BusinessLine, last accessed on January 26, 2022.
[5] Neo-liberalism: Oversold? By Jonathan D Ostry, Prakash Loungani and Dave Furceri, Finance and Development, June 2018, Pp 38-41.
[6] A Disrupted Global Recovery – IMF Blog, last accessed on January 26, 2022.
[7] Another Covid wave will leave world govts ‘much less space to spend’, says IMF’s Gita Gopinath (msn.com), last accessed on January 26, 2022.
[8] Beware the ‘central bank put’ | Financial Times (ft.com), last accessed on January 26, 2022.
[9] central banks: Party on! The central bank put isn’t going away – The Economic Times (indiatimes.com)
[10] ECB’s Knot Warns Against Creating Another ‘Central Bank Put’ – BNN Bloomberg, last accessed on January 26, 2022.
[11] Drought year refers to the year in which the rainfall during the monsoon period (June to Sep) was lower than the normal rainfall. We have used the Indian Meteorological Department’s data to identify the drought years. Consequently, our charts on later pages show the rain deficit during the monsoon season of 2014 as deficit during Fiscal Year 2013-14.
[12] The Middle-Income Trap Turns Ten by Indermit S. Gill and Homi Kharas, The World Bank Group, 2015. They describe middle-income trap to be a state where a country performs below its economic potential. They state that the middle-income countries have strong incentives for inaction, which results in policy drift and sub-par economic performance. These incentives include the short-term focus in political decisions, limited sharing of reform benefits, rent seeking by elites, etc.
[13] Avoiding the Middle-Income Trap: Renovating Industrial Policy Formulation in Vietnam, Kenichi Ohno, Vietnam Development Forum (VDF), Hanoi National Graduate Institute for Policy Studies (GRIPS), Tokyo, 2010. He describes the development trap to be a situation where “a country may rise to a low, Middle- or high- income level with little effort but will eventually get stuck in that income category if it fails to build a national mindset and institutions that encourage constant upgrading of its human capital.”
[14] We have classified sector to be a low value-adding sub-sector if the average labour productivity (Value-added per Employed Person at 2011-12 Prices is lower than the average of the sector. For example, the average value-added per person in manufacturing is INR 437,900 and it is INR 275,300 for Food Products, Beverages and Tobacco. Food Products, Beverages and Tobacco sub-sector is classified as the low value-adding sub-sector. We have used the same approach to classify economic activity for the services sector.
[15] We would be discussing the reasons for low value-addition in the agriculture sector in detail in another paper.
[16] Nowcasting Economic Growth in India: The Role of Rainfall, Tara Iyer and Abhijit Sen Gupta, ADB Economics Working Paper No. 593, October 2019.
[17] Growth rate for years 2019-20 and 2020-21 has been 4.2% and -7.2%, respectively.
[18] Post Covid-19, India, like many other economies, has experienced two successive quarters of negative growth during Fiscal 2020-21.
[19] Growth in Private Final Consumption Expenditure has fallen to a historically low levels during the pandemic, resulting in the level of expenditure during the quarter ending September, 2021 (INR 1,948,346 crore) being lower than September, 2019 (INR 2,019,783 crore).
[20] Post the pandemic, consumer as well as business confidence has fallen significantly. Dec 2021 reading shows the consumer confidence about current situation and future expectations to be 62.3 and 109.6, respectively. Similarly, the business confidence levels are at 96.2 and 111.4, respectively.
[21] Oct 2021 survey too estimates the capacity utilisation to be below 70%.
[22] WHO Coronavirus (COVID-19) Dashboard | WHO Coronavirus (COVID-19) Dashboard with Vaccination Data, last accessed on January 26, 2022.
[23] “The policy maturity and the alacrity displayed to not “waste a crisis” has helped the country to save both ‘lives’ and ‘livelihoods’ in its own unique way and has shifted the focus away from the short-term pain created by the crisis to the potential for long-term gains engendered by the policy response.” Once more, I have no hesitation in saying that the Indian policymaking or the advisory team does not understand the basic definition of uncertainty. Consequently, our policy choices end up being inappropriate, causing short- as well as long-term pain.
[24] Boettke, Peter J and Leeson, Peter T, Introduction, The Economic Role of the State, The International Library of Critical Writings in Economics Series, Edited, Edward Elgar, 2015.
[25] Pundy Pillay, The Role of the State in Economic Development in South Africa, Friedrich-Ebert-Stiftung
Department for Development Policy – Dialogue on Globalization, March 2002.
[26] Ibid, Pp 5.
[27] Economics of the Public Sector, Joseph E Stiglitz, 1986,
[28] Jason Brown, The Role of the State in Economic Development: Theory, The East Asian Experience and the Malaysian Case, Staff Working Paper Number 52, Asian Development Bank, December 1993.
[29] A frequently observed phenomenon is that the key industry players raise prices by similar levels around the same time, e.g., telecom industry when the recent Supreme Court order required them to pay government levies with interest and penalties. The seemingly competitive airlines industry is dominated by just two players. Licenses for city gas distribution, ports and airport businesses have ended up being with a few firms, though through competitive bidding.
[30] Airtel, Vodafone, Jio Calls, Internet to be Costlier from December (thequint.com), last accessed on January 26, 2022.
[31] Telcos tariff hike to spur inflation- The New Indian Express, last accessed on January 26, 2022
[32] Welcome to PNGRB (List of City Gas Authorisations, last accessed on January 26, 2022)
[33] Boettke, Peter J and Leeson, Peter T, Introduction, The Economic Role of the State, The International Library of Critical Writings in Economics Series, Edited, Edward Elgar, 2015.
[34] Title of the first chapter of Volume I, Economic Survey 2019-20.
[35] Chinese Premier Deng Xiaoping quote, “It doesn’t matter whether a cat is white or black, as long as it catches mice.”
[36] Serena Lamartina and Andrea Zaghini, Increasing Public Expenditures: Wagner’s Law in OECD Countries, CFS Working Paper No. 2008/13.
[37] Nowcasting Economic Growth in India: The Role of Rainfall, Tara Iyer and Abhijit Sen Gupta, ADB Economics Working Paper No. 593, October 2019.
[38] Corporate tax: Lok Sabha passes Bill to effect corporate tax reduction – The Economic Times (indiatimes.com), last accessed on January 26, 2022.