
The Indian Growth Paradox: Disconcerting Divergence between Consumer Confidence and Industrial Outlook Surveys
Observations Summary
- A structural break in business’ assessment of current and the future business and economic conditions, i.e., post the discontinuity in Q3 and Q4 of 2008-09, the business’ assessment of current situation as well as the future is less positive.
- Consumers continue to be optimistic about the future, even when their own assessment of the current situation has been in the pessimistic range in 10 out of the last 11 quarters, i.e., for about 4 years.
- Business’s weak assessment of current and the future is based on their experience of low growth in order book, lower capacity utilisation, above average inventory, constraints on availability of finance, lack of pricing power and lower profit margins.
- As for the consumer, they see income and employment to be the main reasons for being pessimistic about the current situation. Consumer expects the discretionary spending to come down.
In view of these findings, we are not surprised that India is experiencing a significant slower growth than in the past.
As a next step, we need to identify the reason for divergence in consumer and business assessment of current situation. And also, why does the consumer think that his or her future will be far better than the present even when their own assessment of the current situation is poor?
Introduction
As we know, economic growth comprises of growth in consumption, investment and net exports (exports – imports) by households, businesses and the government. Investment, particularly household and business, is function of their expectation about the future, i.e., the household and business expectations about demand and supply in the future.
For growth to be sustainable, the households and businesses must see the future to be getting better, i.e., earnings and thereby demand growing consistently (low variability) over time. If the businesses and households are positive about their current situation as well as the future, we can expect economic growth to be sustainable and get better with time. Household and the business’ willingness to spend and invest enhances the government’s ability to spend and invest, as it can expect tax revenue to grow consistently. Increasing revenue allows the government to invest, across cycles, in areas where the private sector will find it uneconomical to invest or will not have the required equity to invest by providing fiscal support when needed.
In this article, we have tried to characterise the current state of perceptions about economic conditions in India using the RBI’s (Reserve Bank of India) quarterly Consumer Confidence and Industrial Outlook survey results. We identify Q3 & Q4 of the fiscal year 2008-09 (April 2008 to March 2009) as a discontinuity in the Indian growth story, as the quarterly growth rate fell from 7-8% to below 2%. In the charts below, we will see that the consumer confidence as well as the industrial outlook too declined sharply, during the last two quarters of 2008-09, though both recovered quickly. However, the business confidence is yet to recover completely till today. We don’t have data on consumer confidence for period prior to the collapse of economic growth, but it has been declining since March 2015.[1]
Industrial Outlook Survey: Design and Purpose
The Industrial Outlook Survey is being conducted by the Reserve Bank of India on a quarterly basis since 1998. The Survey Report for Q 2, 2011 states, “The Survey gives insight into the perception of the public and private limited companies engaged in manufacturing activities about their own performance and prospects. The assessment of business sentiments for the current quarter and expectations for the ensuing quarter are based on qualitative responses on 20 major parameters covering overall business situation, financial situation, demand indicators, price, profit margins and employment situation. The survey provides useful forward-looking inputs for policymakers, analysts and business alike.”
The assessment of the current business sentiment is captured by the Business Assessment Index (BAI) and about the expectations by the Business Expectations Index (BEI).
RBI’s Consumer Confidence Survey: Design
The Consumer Confidence Survey is being conducted on a quarterly basis since June 2010. The Survey Report for 2011 states the following to be its objectives:
“It gives an assessment of the consumer sentiments of the respondents based on their perceptions of the general economic conditions and own financial situation. The assessments are analysed in two parts, viz., current situation as compared to a year ago and expectations for a year ahead.”
The same report (Sep 2011) provides the following details on the Sampling Design:
“The survey covers six metropolitan cities, viz., Bangalore, Chennai, Hyderabad, Kolkata, Mumbai and New Delhi. Each city is divided into three major areas and each major area is further divided into three sub-areas. From each sub-area, about 100 respondents are selected randomly. For each round of survey 5,400 respondents are selected (900 respondents from each city).”
The latest report for July 2019 states, “The survey was conducted in 13 major cities – Ahmedabad; Bengaluru; Bhopal; Chennai; Delhi; Guwahati; Hyderabad; Jaipur; Kolkata; Lucknow; Mumbai; Patna; and Thiruvananthapuram – and obtained 5,351 responses on households’ perceptions and expectations on the general economic situation, the employment scenario, the overall price situation and their own income and spending.”
The current perception is measured through the Current Situation Index (CSI) and the expectations through Future Expectations Index (FEI).
Industrial Outlook: Are we witnessing a Structural Shift in Expectations?
Chart 1 below suggests that the Business Assessment Index (BAI) which experienced a discontinuity post Q4, 2008-09 has remained lower than what it was pre Q4, 2008-09 period (except after sharp immediate recovery and a high of 122.8 in Q3 2010-11).
Chart 1
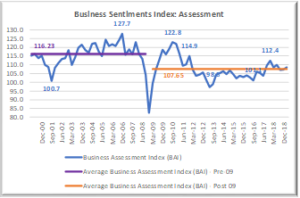
| The average Assessment Index, post the discontinuity of Q4 2008-09, is lower by 8.58 points (down from 116.23 to 107.65). |
A review of the BAI sub-component suggests that the main reasons for weak assessment are low growth in order book, lower capacity utilisation, above average inventory, constraints on availability of finance, lack of pricing power and lower profit margins.
In this situation, we would expect the business to be cautious about investing in the short run, (e.g., building inventory) and prefer productivity enhancing investment with shorter payback.
We observe a similar pattern for the Business Expectations Index (BEI) time series (Chart 2). The BEI series reached its lowest level during Q1, 2009-10, recovers sharply during the following quarters, reaches a peak of 126.5 during Q3, 2010-11.
Post the discontinuity, the expectations (BEI) score has been lower than the average score for 56.1% (23 of 41 quarters) of the quarters compared to 63.4% (26 of 41 quarters) of the quarters for the BAI (current situation index). That is, the business’ assessment of future situation has been better than its perception about the current situation.
Chart 2
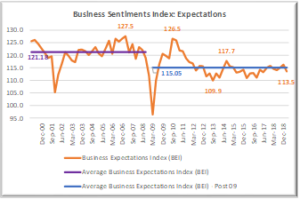
| The average post Q1, 2009-10 is lower by 6.13 index points (down from 121.18 to 115.05). |
A review of the BEI sub-component suggests that the main reasons for low future expectations are no different from the ones that are affecting the current situation, i.e., low growth in order book, lower capacity utilisation, above average inventory, constraints on availability of finance, lack of pricing power and lower profit margins.
In these circumstances, we would expect business not to take risk and invest ahead of demand, i.e., be cautious about long-term or high-risk investment too. Given the assessment of current situation, as well as the future expectations, it is not surprising that business investment has not really recovered all these years. The optimism has had a lower upper bound, even after shifting to a lower trajectory post Q3/Q4 of 2008-09.
Consumer Confidence: Hoping for Better Days, and for many years now!
In the Chart 3 below, India is in a state where the perceptions about the future and current situation have formed a disconcerting jaw since Dec 2013. The Current Situation Index (CSI) has remained lower than the Future Expectations Index and the gap between the two indices has been consistently high and increasing, with differences peaking during Dec 2018 (See Chart 4 of the differences in two indices).
Chart 3
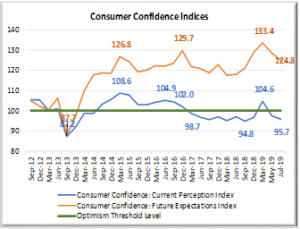
| Consumers have consistently believed that the future will be better than the current situation, that too for nearly 5 years, even when their own assessment of the present has been pessimistic (score below 100) for nearly two years now. |
Chart 4
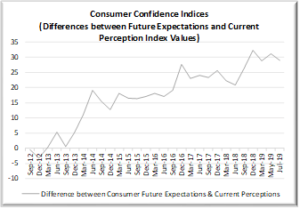
| Continuously widening gap between future expectations and current assessment of situation. |
CSI, after having moved to pessimism zone during March 2017, has been below 100 for 10 out of 11 quarters. The Future Expectations Index (FEI) did follow the decline in the CSI, but gap has continuously widened, as seen in Chart 4 above.
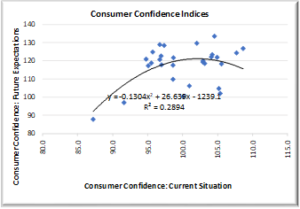
In Chart 5 below, we observe that the correlation between the CSI and FEI has been relatively low, implying that the movement in two indices is not consistent with each other. It is interesting to note that the consumers have managed to remain hopeful about the future even when their own assessment of the current situation is pessimistic (scores below 100).
Chart 5
Lower scores on CSI are explained by lower reading on unemployment, income and economic situation sub-indices (Table 1). The FEI score is high on the same sub-indices (Table 2). For example, while the expected net response on Economic Situation is positive (+ve), the actual response is negative in 21 out of 34 quarters. Net response on employment is also negative for 22 out of 34 quarters. As for price level, the expected reading is negative (lower price level is better), the actual reading is also negative right through. While the score on income is positive, it is low.
Table 1
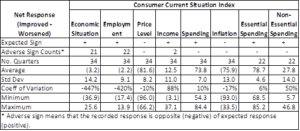
The employment score (net response) has not only been negative (15 out of 16 quarter since Dec 2016), it is observed to have got worse during the recent quarters, except for a brief uptick during March 2019 quarter (Chart 6).
As mentioned earlier, we observe that the Future Expectations (FEI) scores are high and are that of the expected sign.
We also observe that the gap between FEI and CSI Scores on some parameters remain high, even when the current situation is seen to be getting worse – forming a disconcerting jaw once more (Chart 6 & 7). We don’t observe any such divergence in responses on price level (Chart 8)
Table 2
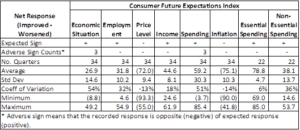
Chart 6 below suggests that the current assessment of employment situation has peaked in Dec 2012 and that of future expectations in June 2014 – assessment of current as well as future expectations has been getting worse except for a burst during March 2019.
Chart 6
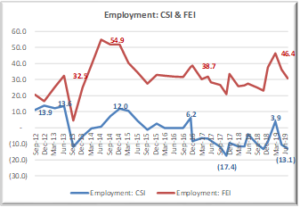
Chart 7
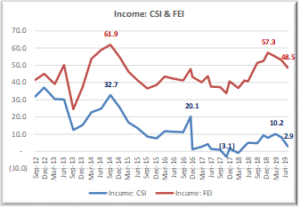
Chart 8
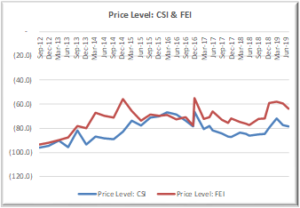
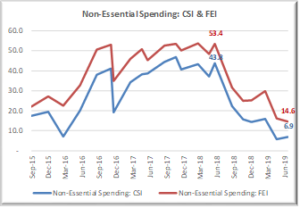
Chart 9 below presents information about the response on non-essential spending. Given the current statement of employment and income, it is not surprising that the index score for non-essential spending has been getting worse since June 2018.
Chart 9 (Data available only from Sep 2015)
The question therefore really is:
When does the consumer remain hopeful of the future for so long, even when the current situation is not seen as improving for nearly five years and what are its implications?
It is possible to remain hopeful when one believes that the current situation is only a cyclical slow-down and employment and income will improve soon.
The recent decline in automobile sales and the continued slow growth in construction sector poses a question – is the consumer, at this stage, losing confidence in his or her future?
Industrial Outlook and Consumer Confidence: A Story of 2-Different Frames[2]
As a next step, we have reviewed the relationship between Consumer Confidence indices and the Industrial Outlook indices. Our expectation is that the two indices should be highly correlated, i.e., the consumer and business should be seeing the same picture.
In Chart 10 below, we observe that the two indices have diverged significantly since March 2017. The only other period where the indices diverged significantly was from Sep 2013 to Sep 2014. It is once again forming a disconcerting jaw, implying that the business’ assessment of the current situation is consistently better than that of the consumer – to the extent that the consumer assessment (CSI) of the current situation is below 100 since March 2017 (except during March 2019) whereas the business’s assessment (BAI) has been above 100 during all these quarters.
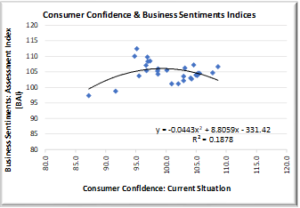
We also observe that the correlation between the two indices is a low of 0.1878 (Chart 11). A low correlation suggests that the consumers and business are probably looking at the situation from different perspectives – seeing two difference pictures. As mentioned above, the consumer index scores are in the pessimism region (below 100, whereas the business index scores are in the optimism range (above 100). The question therefore is:
Business sees lack of demand, constraints on availability of finance, and lack of pricing power as the reasons for holding their optimism down (both in the current situation and its expectations about the future). At the same time, the consumers’ assessment of the current situation is in the pessimism range but the future expectations to be in the high optimism range.
A review of the sub-index scores (on the Expectations Index) suggests that the consumers expect the economic situation, employment and income to increase substantially during the next one year, even when there has been no demonstrated change in their view in the current situation as they see it – a paradox indeed.
Chart 10
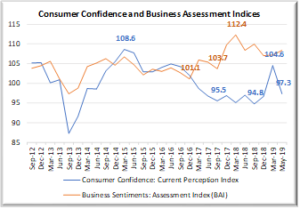
Chart 11
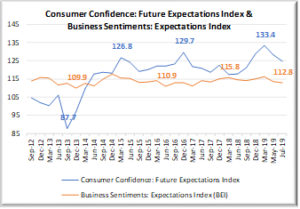
We now review the relationship between the Consumer Future Expectations Index and Business Sentiments: Expectations Index.[3] We observe that the relationship between Consumer and Business indices is not consistent across periods. While the Consumer Confidence till March 2014 was lower than the Business Expectations Index, it has been consistently high since then. The differences between the two indices reaching a peak during March 2019 but falling significantly during the last two quarters to July 2019 (Chart 12).
Chart 12
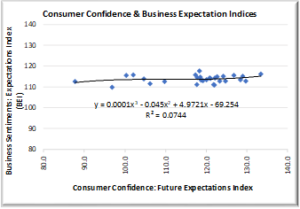
As for the correlation between the two indices, we observe an even low correlation, implying that the industrial outlook and consumer expectations about their future don’t have much to do with each other.
Chart 13
In short, we observe the following:
- A structural break in business’ assessment of current and the future business and economic conditions, i.e., post the discontinuity in Q3 and Q4 of 2008-09, the business’ assessment of current situation as well as the future is less positive.
- Consumers continue to be optimistic about the future, even when their own assessment of the current situation has been in the pessimistic range in 10 out of the last 11 quarters, i.e., for about 4 years.
- Business’s weak assessment of current and the future is based on their experience of low growth in order book, lower capacity utilisation, above average inventory, constraints on availability of finance, lack of pricing power and lower profit margins.
- As for the consumer, they see income and employment to be the main reasons for being pessimistic about the current situation. Consumer expects the discretionary spending to come down.
In view of these findings, we are not surprised that India is experiencing a significant slower growth than in the past.
As a next step, we need to identify the reason for divergence in consumer and business assessment of current situation and also discover why the consumers expect future to be far better than the present, even when their own assessment of the current situation is poor.
Notes
[1] Consumer Confidence Survey was initiated only during Sep 2010.
[2] This section uses information from Sep 2012, as the data for Consumer Confidence Survey is available from that period only.
[3] We would like to highlight that the Consumer Index is based on expectations about the next one year whereas the Business Index is based on expectations for the next quarter.