


Building Economic Resilience in India: From Managing External Vulnerability to Developing Productive Capabilities[1]
Economic performance discussion often focuses on outcomes such as growth, inflation, fiscal balances, exchange-rate stability, foreign-exchange reserves, etc. While these indicators provide useful insights into the state of an economy, they reveal relatively little about the productive capabilities required to sustain prosperity and resilience over the long term. An economy may expand rapidly for extended periods while remaining dependent on imported energy, gold, technologies, products and services. Consistent growth depends on the accumulation of capabilities that enable firms and industries to innovate, diversify, upgrade and compete in increasingly sophisticated global markets.
Productive capabilities encompass knowledge, skills, technologies, industrial ecosystems and organisational competencies that enable an economy to produce goods and services at ever higher levels of complexity and value. Countries that successfully deepen their capabilities can diversify production, expand into new industries, absorb technological change and generate sustainable sources of export earnings. Countries that fail to do so often remain vulnerable to shifts in commodity prices, external financing conditions, technological dependence and changes in demand.
India’s development experience presents an important puzzle. We have achieved significant economic scale, built internationally competitive capabilities in selected sectors, strengthened macroeconomic management and emerged as one of the world’s largest economies. Yet persistent trade deficits, recurring current-account pressures, dependence on imported energy, modest innovation intensity, limited high-technology exports and continuing gaps in manufacturing depth suggest that capability formation has not kept pace with the needs of a growing economy.
India’s growth is inherently import-intensive. Economic expansion requires larger volumes of energy, capital equipment, advanced technologies, critical minerals and other strategic inputs. As incomes rise and industrialization deepens, the demand for such imports is likely to increase rather than diminish. We, therefore, require a corresponding expansion in the economy’s ability to generate foreign exchange through increasingly sophisticated and competitive exports. Long-term resilience depends not on financing import dependence but on reducing its structural significance through capability creation.
Resilience is more than the capacity to withstand shocks or recover from temporary disruptions. It reflects the ability of an economy to continuously expand its productive possibilities, adapt to changing technologies, generate new sources of comparative advantage and sustain external balance without sacrificing growth. Macroeconomic policies, including reserve accumulation and monetary management remain essential elements of resilience, but they address the consequences of structural vulnerabilities and not the underlying causes. Durable resilience ultimately rests on the strength and adaptability of an economy’s productive capabilities.
We argue that India’s resilience challenge is fundamentally a capability challenge. The central issue is not the absence of opportunity. India possesses a large domestic market, substantial human capital, a reasonably diversified production base and significant opportunities for movement into more sophisticated economic activities. The challenge lies in converting these opportunities into realised capabilities through innovation, technology absorption, advanced manufacturing, skill development, institutional strengthening and capability-enhancing investment.
We draw insights from the literature on economic resilience, innovation and economic complexity to examine the relationship between capability formation and resilience in the Indian context. We evaluate India’s inherent and nurtured resilience, analyse the structural sources of external vulnerability, examine indicators of innovation and technological capability, and use the Economic Complexity framework to assess both existing productive capabilities and future diversification opportunities.
Our analysis suggests that India’s principal constraint is not a shortage of opportunities but an incomplete process of capability conversion. Our future resilience will depend less on our ability to manage external pressures and more on our ability to translate productive opportunities into productive capabilities, sophisticated exports and sustainable sources of long-term growth.
Part 1: What Is Economic Resilience, and Is India a Resilient Economy?
In this section, we define economic resilience and assess whether India is a resilient economy. also compare India’s performance on resilience parameters with other large or similar economies.
Economic resilience is defined as a country’s ability to recover from, or adjust to, the negative impacts of external economic shocks. According to Briguglio (1995), resilience is assessed using two distinct dimensions.
Inherent resilience is characterised by features that are largely given in the medium term — the size of the economy, its degree of trade integration, the diversity of its export base, and its dependence on imported energy.
Nurtured resilience, by contrast, is built through deliberate policy action consisting of macroeconomic management, fiscal discipline, exchange-rate stability, and the attraction of productive foreign investment.
A country with weak inherent resilience can partially compensate through strong nurtured resilience. The panels below map each of these two dimensions into a distinct set of measurable indicators, as set out below. The inherent resilience indicators are examined through cross-country comparisons and India’s own historical performance. Together, they form the basis for our conclusion.
| INHERENT RESILIENCE 1.1 Economic Development Level 1.2 Growth Rate & Volatility 1.3 Trade Openness 1.4 Export Concentration 1.5 Net Energy Import Dependence 1.6 Gold Import Dependence | NURTURED RESILIENCE 1.7 Current Account Balance 1.8 Exchange Rate Stability 1.9 Inflation Management 1.10 Fiscal Balance 1.11 Government Debt 1.12 Foreign Direct Investment |
Inherent Resilience
As listed in the left panel above, inherent resilience is assessed across six structural dimensions. Each is a structural feature that shapes how exposed an economy is to external shocks before any policy response.
1.1 Per Capita Income and its Growth: Ability to withstand Shocks
This section assesses economic development level using GDP per capita as a proxy. Although Briguglio (1995) does not treat income level as a core vulnerability variable in his original framework, but he found that resilience is highly correlated with GDP per capita.
Table 1: GDP per Capita, Current USD (1970–2025)
| Country | Level and Growth (CAGR) in Per Capita GDP, Current USD | |||||
| 1991-2008 | 2008-2025 | 1991-2025 | ||||
| Income (1991) | CAGR | Income (2008) | CAGR | CAGR | Income (2025) | |
| Bangladesh | 417 | 4.7% | 1,673 | 8.6% | 6.6% | 2,597 |
| Brazil | 4,284 | 8.3% | 9,958 | 1.1% | 4.7% | 10,713 |
| China | 1,185 | 14.8% | 8,858 | 8.5% | 11.6% | 13,862 |
| Germany | 30,033 | 4.0% | 47,518 | 1.7% | 2.8% | 60,496 |
| India | 522 | 7.3% | 1,833 | 6.0% | 6.6% | 2,702 |
| Japan | 36,306 | 1.9% | 39,806 | -0.6% | 0.6% | 35,951 |
| Indonesia | 1,052 | 7.5% | 3,807 | 5.1% | 6.3% | 5,060 |
| UK | 30,878 | 5.3% | 45,193 | 1.1% | 3.2% | 57,602 |
| USA | 35,614 | 4.1% | 62,568 | 3.7% | 3.9% | 90,027 |
| Mexico | 6,581 | 6.1% | 10,453 | 1.9% | 4.0% | 13,889 |
| Vietnam | 451 | 13.3% | 2,972 | 9.1% | 11.2% | 5,066 |
| World | 6,039 | 4.6% | 11,256 | 2.5% | 3.5% | 14,406 |
Source: World Development Indicators, World Bank
In Table 1 above, India’s 6% growth on a USD 2,700 per capita adds roughly USD 160 per year; but at just 2% growth on USD 90,000 base, US adds USD 1,800 per year, implying that the relative importance of India’s economic contribution to global growth is still limited.
While an average Indian is considered a saver, the absolute amount of per capita saving is naturally low, as the average per capita current income itself is low, which implies that an average Indian household operates with considerably thinner shock-absorption buffers than its counterpart in the advanced economies like the US. Low per capita income also implies that a typical household is a risk-averse household.
1.2 Growth rate and growth volatility (1991-2025)
Growth rate and growth volatility are the second set of elements of the assessment. High average growth helps build resilience only if it is consistent.
In Tables 2.a and 2.b below, we divide the analysis into two eras around the global financial crisis: the pre-crisis period (1990–2008) and the post-crisis period (2008–2024).
Table 2.a: Growth in GDP per Capita, PPP, Constant 2021 USD
| Country | Growth in Per Capita GDP, PPP, Constant 2021 USD | ||
| 1991-2008 | 2008-2025 | 1991-2025 | |
| Bangladesh | 3.53% | 5.00% | 4.26% |
| Brazil | 1.84% | 0.93% | 1.38% |
| China | 9.75% | 6.39% | 8.06% |
| Germany | 1.35% | 0.73% | 1.04% |
| India | 4.29% | 5.08% | 4.69% |
| Japan | 0.79% | 0.75% | 0.77% |
| Indonesia | 2.79% | 3.68% | 3.23% |
| UK | 2.43% | 0.50% | 1.46% |
| USA | 1.96% | 1.39% | 1.67% |
| Mexico | 1.07% | 0.25% | 0.66% |
| Vietnam | 5.78% | 5.08% | 5.43% |
| World | 2.04% | 1.96% | 2.00% |
Source: World Development Indicators, World Bank
Commodity exporters like Brazil and Mexico have seen their risk go up much more than the industrialised nations like Germany and the USA (Table 2.b). Compared with Brazil and Mexico, India’s growth variability is considerably less extreme, implying a moderate degree of inherent resilience derived from its large and diversified domestic economy.
Table 2.b: Risk of Growth — Coefficient of Variation (CoV) of Growth Rates
| Country | Risk of Growth (CoV of Average Growth Rates) in Per Capita GDP, PPP, Constant 2021 USD | ||
| 1991-2008 | 2008-2025 | 1991-2025 | |
| Bangladesh | 36% | 22% | 35% |
| Brazil | 126% | 337% | 196% |
| China | 22% | 32% | 32% |
| Germany | 99% | 343% | 188% |
| India | 55% | 68% | 64% |
| Japan | 160% | 348% | 245% |
| Indonesia | 154% | 49% | 108% |
| UK | 74% | 717% | 213% |
| USA | 80% | 147% | 108% |
| Mexico | 257% | 1030% | 427% |
| Vietnam | 23% | 31% | 27% |
| World | 76% | 105% | 92% |
Source: World Development Indicators, World Bank
During the post global financial crisis period (i.e., from 2008 to 2024), only Bangladesh, India and Indonesia have grown at rates faster than the pre-crisis period between 1990 and 2008 (Table 2.a). At the same time, all the large economies have experienced increased risk of growth – risk measured in terms of coefficient of variation of average growth rate (Table 2.b).
Table 2.c shows an increased participation in global economic activity is expected to come with its own risk with few exceptions such as Bangladesh, China, Vietnam and India, as we have seen during the global financial crisis in 2009 and the global health crisis during 2020 and 2021.
Table 2.c: Risk of Growth (CoV of Average Growth Rates) in Per Capita GDP, PPP, Constant 2021 USD and Trade as % of GDP: Average Level
| Country | Risk of Growth Per Capita GDP and Trade Openness | |||||
| 2008-2011 | 2019-2023 | 1991-2025 | ||||
| Cov | Trade as % of GDP | Cov | Trade as % of GDP | Cov | Trade as % of GDP | |
| Bangladesh | 36% | 42 | 22% | 30 | 35% | 32.3 |
| Brazil | 126% | 24 | 337% | 34 | 196% | 26.2 |
| China | 22% | 50 | 32% | 36 | 32% | 40.7 |
| Germany | 99% | 74 | 343% | 81 | 188% | 68.0 |
| India | 55% | 51 | 68% | 44 | 64% | 38.8 |
| Japan | 160% | 29 | 348% | 38 | 245% | 29.3 |
| Indonesia | 154% | 50 | 49% | 40 | 108% | 53.3 |
| UK | 74% | 58 | 717% | 63 | 213% | 57.1 |
| USA | 80% | 28 | 147% | 25 | 108% | 25.4 |
| Mexico | 257% | 58 | 1030% | 80 | 427% | 60.5 |
| Vietnam | 23% | 132 | 31% | 173 | 27% | 134.9 |
| World | 76% | 57 | 105% | 57 | 92% | 53.6 |
Source: World Development Indicators, World Bank
We discuss era-wise level of participation in global economic activity in the next section.
1.3 Trade Openness: Opportunity for Growth with Risk
The income trajectory established above is inseparable from the question of how India participates in global trade. Greater trade integration increases access to external markets, capital, and technology, but it also amplifies exposure to external demand shocks, supply-chain disruptions, and commodity-price cycles. The degree of openness is, therefore, a double-edged dimension of inherent resilience: beneficial when the export structure is diversified and sophisticated; risky when it is concentrated or commodity linked.
India’s trade-to-GDP ratio rose from about 20% in the early 1990s to 46.2% in 2025, higher than China (37.6%) but well below Mexico (76.4%), Germany (79.9%), and Korea (84.4), and above Brazil (34.8%). These differences reflect economic structure and not necessarily the economic strength. We will discuss the impact of this structure on resilience later in the paper.
Mexico is integrated with North American manufacturing chains, while Korea’s export-led model combines globally competitive industries with large imports of energy and intermediate inputs. France, Germany, and Italy benefit from the EU Single Market, integrated regional supply chains and Germany is trade-intensive because of its export-oriented industrial base. By contrast, the United States records only 25% because its vast, diversified, service-heavy economy absorbs more production domestically. India’s lower ratio similarly reflects its large domestic market, sizeable services sector, and more limited participation in cross-border manufacturing networks.
Table 3: Trade in Goods and Services as % of GDP, 1961-2025
| Country | Trade as % of GDP: Average Level | |||||||||
| 1961-71 | 1971-81 | 1981-91 | 1991-98 | 1998-2000 | 2000-08 | 2008-11 | 2011-19 | 2019-23 | 2023-25 | |
| Bangladesh | 21.2 | 18.8 | 18.4 | 24.2 | 28.5 | 33.3 | 42.0 | 39.3 | 30.1 | 28.6 |
| Brazil | 13.0 | 17.2 | 18.0 | 17.5 | 20.0 | 26.7 | 24.0 | 25.9 | 34.3 | 34.8 |
| China | 5.6 | 12.3 | 22.8 | 32.7 | 34.8 | 52.4 | 50.2 | 41.3 | 36.1 | 37.6 |
| Germany | 31.2 | 36.7 | 44.6 | 44.8 | 53.6 | 65.5 | 73.6 | 78.0 | 80.5 | 79.9 |
| France | 28.7 | 40.6 | 45.7 | 45.9 | 53.6 | 56.4 | 57.1 | 63.5 | 67.1 | 68.6 |
| United Kingdom | 42.8 | 51.8 | 50.0 | 49.5 | 50.3 | 52.8 | 58.4 | 61.8 | 63.4 | 63.4 |
| Indonesia | 23.7 | 44.5 | 49.6 | 59.1 | 76.9 | 60.9 | 50.2 | 44.0 | 39.5 | 42.6 |
| India | 9.4 | 11.9 | 14.1 | 20.8 | 25.1 | 37.5 | 51.1 | 46.7 | 44.0 | 46.2 |
| Italy | 30.2 | 39.1 | 38.8 | 40.6 | 46.6 | 50.3 | 51.4 | 55.9 | 62.0 | 63.4 |
| Japan | 18.9 | 22.3 | 21.0 | 17.1 | 18.7 | 25.0 | 29.0 | 33.3 | 37.8 | 44.2 |
| Korea, Rep. | 24.7 | 52.2 | 55.8 | 51.7 | 62.8 | 67.4 | 91.2 | 83.2 | 77.0 | 84.4 |
| Mexico | 17.5 | 19.6 | 30.5 | 39.1 | 48.7 | 51.0 | 58.1 | 70.4 | 80.0 | 76.4 |
| United States | 10.8 | 15.9 | 18.2 | 21.5 | 23.7 | 25.3 | 28.4 | 28.5 | 25.3 | 25.0 |
| Vietnam | – | – | 44.9 | 80.4 | 105.8 | 133.0 | 132.1 | 143.9 | 172.6 | 176.4 |
| World | 25.8 | 32.6 | 37.2 | 41.9 | 47.1 | 54.1 | 56.9 | 57.0 | 56.9 | 61.1 |
Source: World Development Indicators, World Bank
Level (trade as % of GDP) and composition matter when we measure trade as a factor for economic resilience. Level demonstrates trade openness, which determines how much an economy is exposed to conditions outside its control. Composition determines what that exposure means. Whether the export of goods and services crossing borders are complex and diversified, or narrow and commodity-dependent determines whether rising openness results in external shocks or resilience to an economy. We examine composition initially through export concentration (below) and subsequently, in section 3, through the high-technology export share.
1.4 Export Concentration: Diversity as a Structural Buffer
The export concentration index measures the degree of dependence on a narrow range of export products. A higher index indicates greater concentration and, by extension, greater vulnerability to specific shocks or to fluctuations in the prices of dominant export categories. Conversely, a lower index reflects diversification, which enhances resilience against external shocks (Hirschman, 1945; UNCTAD, 1995). Export diversity acts as a natural hedge. The link between export concentration and growth volatility is direct—an economy with a concentrated export basket will inevitably transmit external sector‑specific shocks into overall growth volatility.
Table 4: Export Concentration Index, 1995–2025
| Country | Export concentration Index, 1995-2024 | ||||||
| 1995-1998 | 1988-2000 | 2000-2008 | 2008-2011 | 2012-2019 | 2019-2023 | 2023-2025 | |
| Bangladesh | 0.35 | 0.37 | 0.38 | 0.41 | 0.41 | 0.40 | 0.40 |
| Brazil | 0.09 | 0.09 | 0.09 | 0.14 | 0.15 | 0.19 | 0.19 |
| China | 0.07 | 0.08 | 0.10 | 0.10 | 0.10 | 0.09 | 0.08 |
| Germany | 0.09 | 0.10 | 0.10 | 0.09 | 0.10 | 0.09 | 0.10 |
| India | 0.13 | 0.15 | 0.14 | 0.16 | 0.14 | 0.14 | 0.16 |
| Indonesia | – | – | 0.13 | 0.16 | 0.14 | 0.14 | 0.14 |
| Japan | 0.13 | 0.14 | 0.14 | 0.13 | 0.13 | 0.14 | 0.16 |
| Mexico | 0.12 | 0.12 | 0.14 | 0.15 | 0.14 | 0.13 | 0.13 |
| United States | 0.08 | 0.09 | 0.08 | 0.08 | 0.10 | 0.09 | 0.10 |
| Viet Nam | 0.20 | 0.22 | 0.21 | 0.13 | 0.18 | 0.17 | 0.15 |
Source: United Nations Conference on Trade and Development
India’s export concentration index has remained in the moderate range throughout the study period which is lower than Bangladesh, Brazil, and Vietnam, but more concentrated than Germany, the United States, and China. This moderate score means India has achieved meaningful export diversification, but substantial share of India’s export structure has been concentrated in static and domestically oriented industries, revealing persistent structural weaknesses (Rashid, M., Sarin, V., & Esquivias, M. A.,2026).
1.5 Net Energy Import Dependence
Export concentration tells us that India has moderate level of export diversity to buffer external shocks; energy import dependence tells us why those shocks will keep coming.
High import dependence particularly for energy is the most consequential source of inherent vulnerability in the Indian case. Energy imports expose an economy to global commodity-price volatility, geopolitical supply disruptions, and a structural drag on the current account balance. It cannot be managed away by monetary policy, fiscal policy, or exchange-rate intervention or by passing the risk of households. It can only be addressed structurally either by developing domestic energy capacity or by generating sufficient high-value export revenues to offset the import bill, as Germany, China, and Japan have done or through significant reduction in energy intensity of GDP.
Table 5: Net Energy Imports (% of Energy Use), 1991–2023
| Country | Net Energy Import, 1991-2023 | |||||
| 1991-1998 | 1988-2000 | 2000-2008 | 2008-2011 | 2012-2019 | 2019-2023 | |
| Bangladesh | 14.48 | 17.65 | 17.95 | 15.54 | 22.10 | 37.16 |
| Brazil | 29.70 | 25.86 | 14.54 | 9.43 | 6.21 | -8.01 |
| China | -1.18 | 1.34 | 4.65 | 12.25 | 18.95 | 22.28 |
| Germany | 58.06 | 61.47 | 62.15 | 63.04 | 65.70 | 68.59 |
| India | 15.48 | 20.85 | 24.16 | 29.80 | 36.55 | 36.89 |
| Indonesia | -78.22 | -71.73 | -72.33 | -104.48 | -112.55 | -88.71 |
| Japan | 83.19 | 81.42 | 83.40 | 84.35 | 93.89 | 89.21 |
| Mexico | -53.56 | -48.97 | -43.50 | -22.25 | 2.58 | 17.44 |
| United States | 21.20 | 25.91 | 29.52 | 24.65 | 9.81 | -4.91 |
| Viet Nam | -19.91 | -33.37 | -36.63 | -17.54 | 11.17 | 38.40 |
Source: World Development Indicators, World Bank
India’s net energy import dependence has risen sharply, from 15.5% during 1991–1998 to 36.9% during 2019–2023, a trajectory driven by the energy demands of industrialization and urbanisation. This creates a direct structural vulnerability. Every spike in global crude oil prices automatically widens the trade deficit, puts pressure on rupee exchange rate and inflation.
Germany and Japan, despite energy import dependence of 65–93%, run persistent current account surpluses (2002-2025) because their manufactured export revenues more than offsets their energy bills – a proof that energy import dependence need not constrain resilience if the export structure is sufficiently sophisticated and the country focuses on high-technology export development.
India’s energy import dependence, therefore, becomes not only an energy policy problem, but also and export-complexity problem. Germany’s energy import dependency is substantially higher than India’s (65–67% versus 37%) and yet it runs a large current account surplus. The difference is not the scale of import dependence alone, but also the level and the nature of exports.
1.6 Gold and Food Import Dependence: An Inherent Vulnerability Outside Briguglio’s Original Framework
Briguglio’s (1995) framework locates inherent economic vulnerability in four structural features: the size and diversification of the economy, openness to trade, export concentration, and dependence on strategic imports — typically energy and food — that a country cannot avoid importing because its production or consumption depends on them.
Gold does not meet Briguglio’s definition of a strategic import. Crude oil is imported because industrial output, transport, and electricity generation require it. A barrel not imported is a barrel of activity foregone. Gold, by contrast, adds very little to output, employment, or export capacity once it crosses the border. It is held as jewellery, as a savings instrument, or as an inflation and currency hedge, and by convention is drawn down only in genuine household emergencies.
It is, in a way, the purest possible case of a non-productive import. Money leaves the country’s foreign exchange cover and is converted into an asset that rarely re-enters the productive economy. This is what distinguishes gold from every other item in Briguglio’s strategic-import category, and it is the basis for treating it as a separate, sixth indicator of inherent vulnerability.
Table 6: Average Gold Import as % of Merchandise Trade, 1992-2025
| Country | Gold Import as % of Merchandise Trade, 1992-2025 | ||||||
| 1992-1998 | 1998-2001 | 2001-2008 | 2008-2011 | 2011-2019 | 2019-2023 | 2023-2025 | |
| Brazil | 1.30% | 0.80% | 0.10% | 0.33% | 0.49% | 0.42% | 0.52% |
| China | 2.31% | 1.00% | 0.71% | 1.73% | 2.27% | 1.91% | 2.68% |
| Germany | 0.06% | 0.09% | 0.01% | 0.39% | 0.46% | 0.56% | 0.26% |
| India | 18.11% | 13.91% | 7.60% | 8.77% | 8.01% | 6.89% | 8.79% |
| Indonesia | 2.82% | 2.03% | 1.60% | 1.47% | 1.63% | 1.50% | 2.37% |
| Japan | 0.45% | 0.33% | 0.13% | -0.09% | 0.06% | 0.06% | 0.19% |
| Mexico | 0.47% | 0.31% | 0.04% | 0.18% | 0.20% | 0.16% | 0.18% |
| USA | 0.54% | 0.42% | 0.31% | 0.43% | 0.32% | 0.44% | 0.51% |
| Vietnam | 5.43% | 3.44% | 3.26% | 4.09% | 1.87% | 0.92% | 1.11% |
Source: World Development Indicators, World Bank
Gold import shows how much of a country’s trade basket is absorbed by a non-productive asset. On this measure as a share of total merchandise trade, India’s gold-import declined from 18.11% in 1992–1998 to 7.60% by 2001–2008. From then onwards, it has increased and has reached the level of 8.79%, the highest level since 2008–2011. Except China, no other country in the panel comes close to this range. This shows that a disproportionate share of India’s merchandise trade is devoted to an import that does not expand productive capacity, export earnings, or industrial resilience.
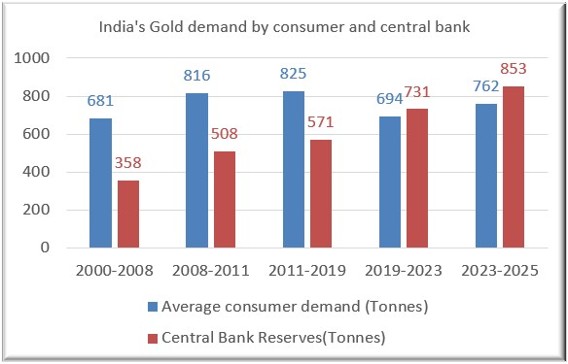
India’s demand for gold during the last quarter of a century has been driven by consumers as well as the RBI. Chart 1 below shows that both average household demand and central-bank reserves for gold increased during the first three eras. From 2019 onward, however, central-bank reserves rose significantly, from 571 tonnes in 2011–2019 to 731 tonnes in 2019–2023, while household demand fell from 825 tonnes to 694 tonnes over the same period. This decline in household demand reflected the pandemic’s impact on incomes and household savings. Household demand subsequently recovered to 762 tonnes in the following era.
Chart 1: Evolution of gold demand both by consumer and central banks, 2000-2025
Source: World Gold Council
In addition to energy and gold imports, food imports continue to be significant source of stress on trade balance, with oilseeds and edible oil being the major sources of that stress.
Food’s share of India’s import basket shows a different pattern. An early decline followed by a slow, sustained climb. It fell from 4.70% in 1991–1998 to a low of 3.25% in 2008–2011, then rose steadily across every era since, reaching 4.88% in 2023–2025. This upward trend is similar for Indonesia, China, and Vietnam with China’s food-import share more than doubling from 3.83% (2001–2008) to 8.55% (2023–2025) and Vietnam’s rising from 6.23% to 8.80% over the same period.
Table 7: Average Food Import as % to Total Merchandise Import, 1991-2025
| Country | Average Food Import as % to Total Merchandise Import, 1991-2025 | ||||||
| 1991-1998 | 1998-2001 | 2001-2008 | 2008-2011 | 2011-2019 | 2019-2023 | 2023-2025 | |
| Bangladesh | 16.86 | 16.38 | 17.27 | 18.48 | 16.37 | – | – |
| Brazil | 10.21 | 7.45 | 5.28 | 4.77 | 5.46 | 5.48 | 5.53 |
| China | 4.98 | 4.24 | 3.83 | 4.74 | 6.07 | 8.17 | 8.55 |
| Germany | 9.76 | 7.81 | 7.14 | 7.75 | 8.00 | 7.98 | 8.78 |
| Indonesia | 8.13 | 11.54 | 9.62 | 8.51 | 9.94 | 11.52 | 11.29 |
| India | 4.70 | 6.04 | 4.03 | 3.25 | 4.38 | 4.78 | 4.88 |
| Japan | 16.26 | 14.22 | 10.90 | 9.40 | 9.44 | 9.70 | 9.66 |
| Mexico | 7.77 | 5.41 | 6.27 | 6.98 | 6.09 | 6.18 | 6.33 |
| United States | 5.20 | 4.41 | 4.38 | 4.95 | 5.67 | 6.60 | 6.86 |
| Viet Nam | 5.03 | 5.61 | 6.23 | 7.92 | 8.25 | 8.18 | 8.80 |
Source: World Integrated Trade Solution
Gold imports have always been an adverse factor impacting inherent resilience. Food imports, particularly oilseeds and edible oils, too add to the challenge.
Nurtured Resilience
Having defined and assessed inherent resilience through cross-country comparisons, the analysis now shifts to nurtured resilience — the capacity that India has built through deliberate macroeconomic management. The six indicators examined below are current account balance, exchange rate stability, inflation, fiscal balance, government debt, and foreign direct investment.
1.7 Current Account Balance: The Chronic Structural Deficit
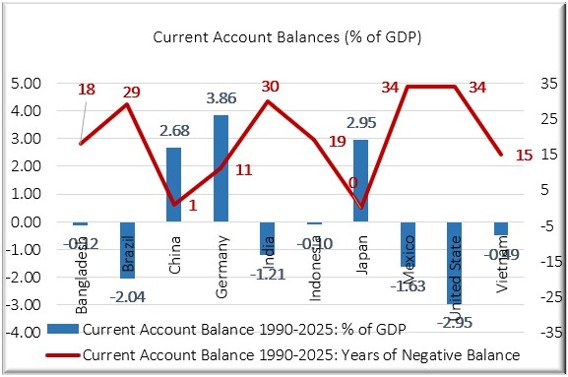
The current account deficit is the single most important bridge between inherent and nurtured resilience. A country that runs a persistent current account deficit must attract capital account surpluses each year to finance it, creating a dependence on global investor sentiment and making it vulnerable to external financial shocks. The most durable form of resilience had been exemplified by Japan, Germany, and China who had built a foundation of sustained current account surpluses generated by high value-adding manufactured exports.
Chart 2: Current Account Balance (% of GDP) and Years of Negative Balance, 1990–2025
Source: World Development Indicators, World Bank
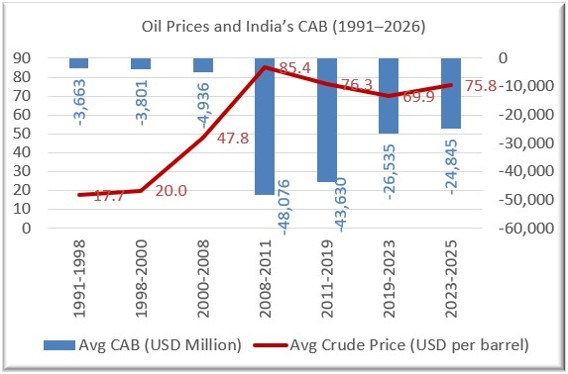
Japan has recorded no current account deficit in the past three decades; China has, only once. The United States sustains a chronic deficit because the dollar’s reserve currency status guarantees global demand for US financial assets, a privilege no other economy has. India, by contrast, has run a current account deficit in 30 of the last 35 years, often driven by a persistent merchandise trade deficit. This chronic deficit (Chart 3) requires India to attract capital account surpluses each year and to accumulate foreign exchange reserves.
Chart 3: India’s Current Account Balance
Source: Database on Indian Economy, RBI
Export of Services and Financial Transfers: Offset the Deficit but not always
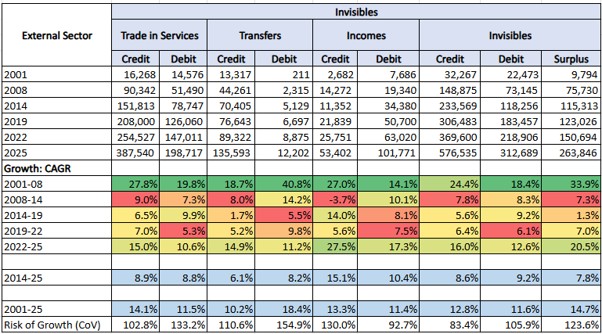
The invisibles surplus provides a partial offset to the merchandise trade deficit (Table 8 below). It grew at a CAGR of 14.7% between 2001 and 2025, expanding from USD 9.8 billion to USD 263.8 billion. The invisibles surplus grew at 33.9% CAGR during 2001–2008, the highest among all categories in that period, driven by India’s IT and business services boom before the global financial crisis (GFC). Growth was sluggish from the post‑GFC period to the pandemic. But from 2022 onwards, the invisibles surplus grew at 20.5% CAGR, the highest since GFC.
Table 8: Invisibles Account Balances — Trade in Services, Transfers, Incomes
Source: Database on Indian Economy, RBI
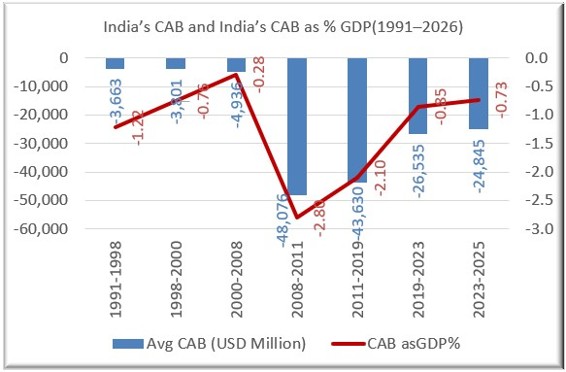
Chart 4 suggests that oil prices are one of the most important determinants of India’s current account balance.
Chart 4: Crude Oil Prices (USD/barrel) and India’s Current Account Deficit (USD Million), 1991–2024
Source: IMF Primary Commodity Prices Database (POILAPSP series), World Economic Outlook Database.
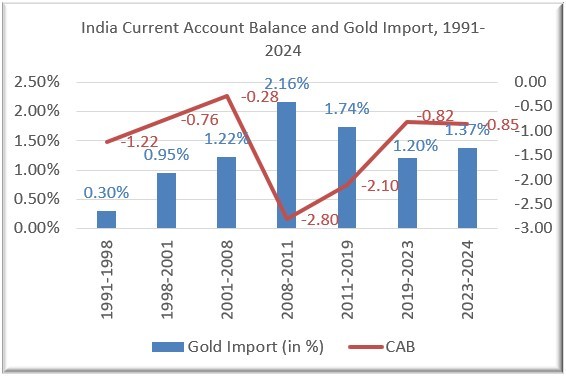
Chart 5: India Current Account Balance (% in GDP) and Gold Import (% in GDP), 1991-2024
Source: UN Comtrade, Database on Indian Economy, RBI
Chart 5 extends the oil-price story with a second commodity import that has moved on a similar cycle. Using the same era structure applied throughout this paper, India’s gold import bill as a share of GDP rose from 0.30% in 1991–1998 to a peak of 2.16% in 2008–2011 — the identical period in which Chart 4 shows global oil prices driving India’s trade deficit to its widest point in the series — before easing to 1.74% in 2011–2019 and settling in a 1.20–1.37% range across 2019–2024.
The current account balance moved in step: from a manageable deficit of -1.22% of GDP in 1991–1998, briefly toward near-balance in 2001–2008 (-0.28%), then sharply to -2.16% in 2008–2011 as both oil and gold imports peaked together, before recovering to the -0.82% to -0.85% range recorded most recently.
Table 10 below shows that Japan holds the largest reserve buffer (15.2 months) which is also the most energy-import dependent economy comparing to other economies, while Germany has thin reserves of almost 2 months with high dependence (69%). India has accumulated a comfortable reserve of 9.2 months. India is more exposed to energy price shocks than before but better capitalised to absorb them. Foreign Exchange Reserves provide buffer against shocks but do nothing to reduce the underlying structural exposure.
Table 9: Level of Reserves and Energy Import Dependence
| Level of Foreign Reserves and Import Dependence of Energy Consumption, 1991 – 2023 | ||||||||||||
| Country | 1991-1998 | 1998-2001 | 2001-2008 | 2008-2011 | 2011-2019 | 2019-2023 | 1991-1998 | 1998-2001 | 2001-2008 | 2008-2011 | 2011-2019 | 2019-2023 |
| Energy Imports, Net (% of Energy Use) | Total Reserves in Months of Imports | |||||||||||
| Bangladesh | 15 | 19 | 18 | 16 | 22 | 37 | 4.3 | 2.1 | 2.5 | 3.7 | 5.5 | 5.7 |
| Brazil | 30 | 25 | 13 | 9 | 7 | -8 | 7.0 | 4.7 | 6.7 | 10.5 | 12.9 | 11.2 |
| China | -1 | 1 | 5 | 12 | 18 | 22 | 8.5 | 13.1 | 14.9 | 21.4 | 17.1 | 12.6 |
| Germany | 57 | 62 | 62 | 63 | 66 | 69 | 2.3 | 1.6 | 1.2 | 1.6 | 1.6 | 1.9 |
| India | 15 | 21 | 24 | 30 | 36 | 37 | 4.9 | 6.4 | 9.7 | 7.9 | 7.2 | 9.2 |
| Japan | 84 | 81 | 83 | 84 | 94 | 89 | 5.9 | 8.6 | 14.7 | 15.7 | 15.4 | 15.2 |
| Indonesia | -79 | -70 | -73 | -104 | -115 | -89 | 3.5 | 5.6 | 5.4 | 5.9 | 6.1 | 6.5 |
| United States | 21 | 27 | 30 | 25 | 11 | -5 | 1.9 | 1.0 | 1.0 | 1.7 | 1.6 | 1.8 |
| Mexico | -54 | -49 | -43 | -22 | 0 | 17 | 2.9 | 2.3 | 3.1 | 3.9 | 4.3 | 4.0 |
| Vietnam | -18 | -34 | -37 | -18 | 9 | 38 | 1.7 | 2.3 | 2.9 | 2.2 | 2.3 | 3.3 |
Source: World Development Indicators, World Bank
1.8 Exchange Rate Stability: Improvement within Structural Limits
The persistent current account deficit is the primary driver of rupee weakness. Exchange rate management is, therefore, not separable from the current account problem. A stable currency reduces the cost of imported input by reducing the hedging cost, helps contain inflation, and provides a predictable environment for trade and investment. But it does not solve the problem.
Table 10: Year-on-Year Exchange Rate Change (%), 2004–2025
| Country | YoY Exchange Rate Change, 2004-2025 | |||||||||
| 2004-2008 | 2008-2011 | 2012-2019 | 2019-2023 | 2023-2025 | ||||||
| Mean | Cov | Mean | Cov | Mean | Cov | Mean | Cov | Mean | Cov | |
| Brazil | -6.61 | -64% | -3.43 | -225% | 12.06 | 112% | 7.15 | 177% | 2.77 | 167% |
| Japan | -3.29 | -196% | -9.24 | -23% | 4.41 | 227% | 5.22 | 152% | 4.48 | 89% |
| Mexico | 4.12 | 64% | 3.77 | 281% | 5.91 | 129% | -1.30 | -592% | -1.20 | -627% |
| Indonesia | 3.37 | 149% | -0.70 | -1141% | 6.31 | 97% | 1.39 | 160% | 3.53 | 19% |
| India | 0.85 | 574% | 3.25 | 186% | 5.38 | 86% | 3.87 | 60% | 3.52 | 46% |
| Bangladesh | 2.96 | 121% | 1.90 | 141% | 1.72 | 237% | 5.13 | 118% | 10.03 | 43% |
| China | -3.11 | -99% | -3.95 | -77% | 0.89 | 382% | 1.48 | 300% | 2.21 | 99% |
| Vietnam | 1.62 | 20% | 6.29 | 57% | 1.47 | 191% | 1.03 | 90% | 1.90 | 17% |
Source: World Development Indicators, World Bank
Compared with Brazil, Indonesia, and Bangladesh, India has experienced lower and declining exchange-rate volatility over time, a sharp reduction in coefficient of variation across periods reflects improvement in macroeconomic management. The decline in volatility is partly a consequence of active RBI interventions, which provide temporary relief, but do not address the structural weakness.
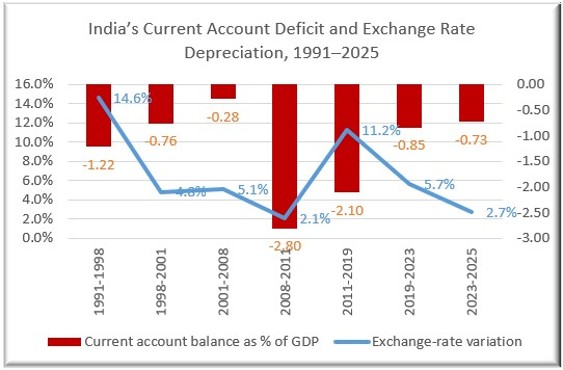
Chart 6: India’s Current Account Deficit and Exchange Rate Depreciation, 1991–2025
Source: World Development Indicators, World Bank; Database on Indian Economy, RBI
The RBI has been actively involved in exchange rate management due to which depreciation in exchange rate decreased from 1991 onwards while the lowest was 2.1% which occur in the period of 2008-2011 with highest average current account deficit (Chart 6 above). The highest decline (11.2%) occurred during 2011-19, when the deficit was −2.10% of GDP. The 1991–1998 period had the highest decline (14.6%), reflecting the one-off devaluation during the early liberalisation period. INR has continued to depreciation even with lower current account deficit since 2019.
1.9 Inflation Management: A Policy Achievement or a Benign Commodity Cycle
Price stability is a foundational element of nurtured resilience: high and volatile inflation erodes real incomes, distorts investment decisions, reduces the purchasing power of foreign exchange earnings, and forces monetary tightening at exactly the moment when growth support is needed.
India’s inflation trajectory shows a marked transition from the high, volatile levels of the 1990s toward a lower and more stable level in the most recent period.
India’s headline inflation has declined from an average of approximately 9.4% during 1991–1998 to approximately 5.8% during 2011–2019 and approximately 4.0% during 2023–2025 (Table 11).
Table 11: Year-on-Year Inflation Change (%), 1991–2025
| Country | YoY Inflation Change (%), 2004-2025 | |||||||||||||
| 1991-1998 | 1998-2000 | 2000-2008 | 2008-2011 | 2012-2019 | 2019-2023 | 2023-2025 | ||||||||
| Mean | SD | Mean | SD | Mean | SD | Mean | SD | Mean | SD | Mean | SD | Mean | SD | |
| Bangladesh | 6.3 | -3.4 | 5.6 | 2.4 | 6.0 | 3.0 | 7.8 | 3.2 | 6.2 | 1.5 | 6.9 | 1.6 | 9.3 | 0.6 |
| Brazil | 9.7 | 7.9 | 5.5 | 3.0 | 6.9 | 2.6 | 5.7 | 0.8 | 5.8 | 2.1 | 5.9 | 2.2 | 4.6 | 0.2 |
| China | 4.1 | 4.6 | -0.3 | 1.2 | 2.0 | 2.0 | 2.9 | 1.5 | 2.3 | 1.0 | 1.6 | 1.6 | 0.2 | 0.5 |
| Germany | 1.1 | 0.6 | 1.2 | 0.8 | 1.7 | 0.7 | 1.5 | 0.6 | 1.3 | 0.7 | 4.0 | 3.9 | 2.6 | 0.3 |
| India | 9.4 | 0.7 | 5.2 | 2.7 | 5.3 | 1.8 | 9.5 | 1.8 | 5.8 | 2.4 | 5.8 | 0.7 | 4.0 | 0.8 |
| Indonesia | 25.7 | 30.0 | 29.6 | 34.1 | 9.3 | 3.7 | 6.1 | 3.2 | 4.5 | 2.1 | 2.9 | 1.3 | 2.4 | 0.6 |
| Japan | 0.6 | 0.9 | -0.4 | 0.7 | -0.1 | 0.7 | -0.4 | 1.1 | 0.8 | 0.8 | 1.4 | 1.8 | 2.8 | 0.1 |
| Mexico | 28.5 | 14.3 | 13.3 | 4.0 | 5.1 | 1.7 | 4.6 | 1.2 | 3.9 | 1.2 | 5.2 | 2.1 | 4.2 | 0.4 |
| United States | 2.3 | 0.6 | 2.7 | 0.8 | 2.6 | 1.0 | 1.9 | 0.9 | 1.6 | 0.8 | 4.1 | 2.3 | 3.0 | 0.2 |
| Vietnam | 6.5 | 15.6 | -4.6 | 5.8 | 7.2 | 6.1 | 14.4 | 5.3 | 3.9 | 4.9 | 3.1 | 1.9 | 3.3 | 0.3 |
Source: World Development Indicators, World Bank
The adoption of a formal inflation-targeting framework in 2016 coincides with this moderation and is consistent with the contribution from improved monetary policy credibility. India’s inflation remains higher than China’s and Germany’s but lower than several emerging-market peers in recent periods. Post the global financial crisis, except during the COVID years, the global commodity price environment too has been fairly benign.
1.10 Fiscal Balance
Fiscal balance is the critical indicator of an economy’s capacity to absorb and respond to both external and domestic shocks. Strong fiscal health helps countries to reduce reliance on external borrowing, maintains investor’s confidence while funding social safety nets and prevents domestic crises.
India experienced a significant deterioration in its fiscal position during the COVID-19 pandemic and, despite subsequent consolidation, continues to run a larger deficit than most peer economies. The ongoing consolidation reflects commitment, but the relatively high deficit constrains the government’s ability to respond to future shocks. The fiscal position is, therefore, a nurtured resilience constraint rather than a nurtured resilience asset — a constraint that is being gradually addressed. This has direct implications for how India must build resilience.
Table 12: Government Fiscal Balance, 1991–2025 (% of GDP)
| Country | Government Fiscal Balance (% of GDP), 1991-2025 | |||||
| 1991-1998 | 1998-2001 | 2001-2008 | 2008-2011 | 2011-2019 | 2019-2022 | |
| Bangladesh | -0.66 | -2.37 | -2.46 | -2.81 | -3.45 | -4.49 |
| Brazil | -8.12 | -6.42 | -3.70 | -2.74 | -5.51 | -5.64 |
| China | -1.05 | -2.21 | -1.49 | -0.56 | -2.40 | -7.35 |
| Germany | -3.74 | -2.22 | -2.35 | -2.13 | 0.74 | -2.23 |
| India | -7.85 | -9.31 | -8.65 | -8.87 | -7.18 | -9.85 |
| Indonesia | -0.03 | -1.62 | -0.46 | -0.88 | -2.02 | -3.78 |
| Japan | -3.33 | -7.57 | -5.10 | -7.97 | -5.14 | -6.28 |
| Mexico | -1.74 | -3.56 | -1.64 | -2.91 | -2.96 | -3.66 |
| United States | -3.17 | 0.61 | -3.49 | -10.12 | -5.57 | -8.77 |
| Viet Nam | -0.10 | -1.29 | -1.21 | -2.11 | -3.21 | -1.11 |
Source: IMF – Fiscal Monitor
As Rajakaruna and Suardi (2021) show, fiscal balances and external balances are linked, with causality running both ways rather than only from fiscal to the current account. If the fiscal channel — the transmission mechanism linking fiscal balances (government budget deficits or surpluses) with external balances (current account deficits or surpluses) is constrained, structural transformation through export upgrading, which reduces the current account deficit, becomes essential (IMF External Sector Report, 2026).
1.11 Government Debt
The debt-to-GDP ratio provides a cumulative measure of the fiscal burden and the economy’s long-run capacity to absorb shocks. Unlike the fiscal balance, which measures annual borrowing, the debt ratio captures the accumulated legacy of past deficits and the structural constraints it imposes on future policy space. High debt ratios limit the credibility of counter-cyclical commitments and raise the risk premium on sovereign borrowing during stressed periods.
Table 13: General Government Debt, 1991–2025 (% of GDP)
| Country | General Government Debt (% of GDP), 1991-2026 | ||||||
| 1991-1998 | 1988-2001 | 2001-2008 | 2008-2011 | 2011-2019 | 2019-2023 | 2023-2025 | |
| Bangladesh | – | – | 36 | 31 | 29 | 36 | 41 |
| Germany | 51 | 59 | 64 | 75 | 71 | 64 | 63 |
| Japan | 87 | 132 | 166 | 201 | 227 | 221 | 211 |
| United States | – | 13 | 63 | 89 | 105 | 121 | 123 |
| China | 11 | 23 | 26 | 32 | 45 | 73 | 95 |
| India | 73 | 74 | 81 | 71 | 70 | 85 | 84 |
| Vietnam | – | 13 | 29 | 35 | 43 | 38 | 31 |
| Brazil | – | 32 | 67 | 62 | 72 | 88 | 90 |
| Mexico | 15 | 39 | 38 | 41 | 48 | 55 | 59 |
| Indonesia | – | 40 | 49 | 27 | 27 | 38 | 39 |
Source: IMF – Fiscal Monitor
India’s debt ratio increased from 73.10% in 1991–1998 to a peak of 84.51% in 2019–2023 before easing slightly to 84.31% in 2023–2025 as Chart 11 shows. Compared to other countries, India’s debt level remains higher throughout the entire period. Mexico rose from 15.17% (1991–1998) to just 59.08% (2023–2025), and Vietnam from 12.54% (1998–2001) to 31.39% (2023–2025). For India, debt remains high by its own historical standard and higher than every peer in Table 13 throughout the period; its rate of increase slowed markedly between 2001–2019 before the pandemic-era spike reversed a decade of gradual improvement.
1.12 Foreign Direct Investment (FDI) and Foreign Institutional Investment (FII)
If fiscal and monetary mechanisms face structural limits, the remaining nurtured resilience lever is the quality and composition of foreign direct investment and foreign institution investment. Specifically, inflows that help build productive capabilities do what the monetary and fiscal policy (to lesser extent) cannot. Stable, growing FDI inflows reflect investor confidence in an economy’s long-term prospects, provide a predictable external financing source for the current account which directs into capability-building sectors and strengthens the productive base. The composition of FDI matters as much as its volume.
Table 14: Foreign Direct Investment (% of GDP), 1991-2025
| Country | Average Foreign Direct Investment, 1991-2025 (% of GDP) | ||||||
| 1991-1998 | 1998-2000 | 2000-2008 | 2008-2011 | 2011-2019 | 2019-2023 | 2023-2025 | |
| Bangladesh | 0.10 | 0.42 | 0.66 | 1.10 | 1.07 | 0.41 | 0.31 |
| Brazil | 1.19 | 4.37 | 2.96 | 3.13 | 3.68 | 3.16 | 3.13 |
| China | 4.30 | 3.85 | 3.81 | 3.45 | 2.21 | 1.24 | 0.19 |
| Germany | 0.47 | 5.94 | 3.00 | 1.87 | 2.09 | 2.62 | 1.36 |
| India | 0.41 | 0.62 | 1.43 | 2.48 | 1.71 | 1.57 | 0.73 |
| Indonesia | 1.49 | -1.45 | 0.40 | 1.76 | 2.09 | 1.86 | 1.65 |
| Japan | 0.03 | 0.20 | 0.22 | 0.21 | 0.36 | 0.86 | 0.44 |
| Mexico | 1.86 | 2.32 | 2.72 | 2.34 | 2.66 | 2.44 | 2.08 |
| United States | 1.05 | 2.99 | 1.86 | 1.72 | 1.80 | 1.43 | 1.18 |
| Viet Nam | 7.55 | 5.08 | 4.96 | 6.64 | 4.59 | 4.45 | 4.25 |
Source: World Development Indicators, World Bank
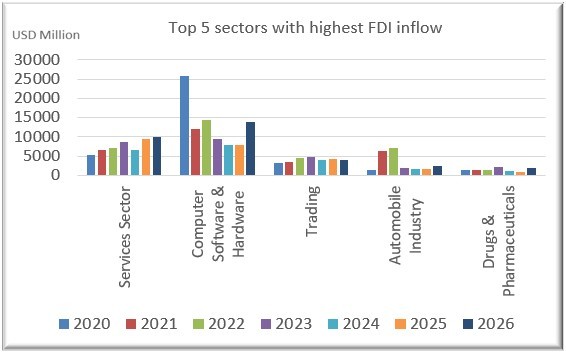
Chart 7: India’s top 5 sectors with highest FDI inflow
Source: Department for Promotion of Industry and Internal Trade
India’s FDI-to-GDP ratio has risen from near-negligible levels in the 1990s to a peak of 2.48% during 2008–2011, before declining to 1.57% during 2019–2023 and falling further to 0.73% during 2023–2025. India’s FDI level sits below Mexico (2.44% of GDP during 2019–2023) and Indonesia (1.86%), and the declining trend since 2011 is the more salient finding than the earlier acceleration.
The composition of inflows matters as much as their share of GDP. The top 5 sectors attract almost 50% of India’s total FDI. India is attracting FDI but most of it is going into services, software, and light assembly. It is not going into deep manufacturing, advanced components, or high-value upstream industries which makes India a hub for assembly and services, but not for designing, making, or exporting complex goods. This is the same assembly-versus-capability distinction that structures the high-technology analysis in later sections.
FII Flows add to India’s Capital Flow Challenges
India’s ability to enhance its resilience becomes even more compromised as volatile FII flows put pressure on its foreign exchange market. In many years, lower FDI has been accompanied by lower or negative FII flows.
Table 15 below shows that for the last 27 years FDI’s CoV is 49% whereas FII’s CoV is 163%, confirms that FII’s are more volatile across the period. FDI’s CoV ranges from 8%-51% in every era which shows India as a reliable economy for consistent and long-term investments. But in every period, we can observe that FII’s CoV is higher than that of FDI. We observe an exceptionally high CoV during 2019-2023 because of alternative inflow and outflow every single year within the same era. The recent era with global uncertainty resulted in crash of both FDI and FI, but risk of growth of FII is way higher than that of FDI suggests FII as destabilizing component as compared to FDI.
Table 15: Inflow and Outflow of FDI (% of GDP) and FII (% of GDP), 1998-2025
| Inflow (+) Outflow (-) | Foreign Institutional Investment | Foreign Direct Investment (%) |
| 1998 | 2.140% | 0.63 |
| 2001 | 0.393% | 1.06 |
| 2008 | -0.809% | 3.62 |
| 2011 | 1.129% | 2.00 |
| 2014 | 2.461% | 1.70 |
| 2019 | -0.190% | 1.78 |
| 2023 | -0.197% | 1.49 |
| 2025 | -0.228% | 0.69 |
| Risk of Growth (CoV) | ||
| 1998-2001 | 84% | 24% |
| 2001-2008 | 69% | 51% |
| 2008-2011 | 188% | 38% |
| 2011-2019 | 110% | 16% |
| 2019-2023 | 11648% | 25% |
| 2023-2025 | 212% | 8% |
| Average | 2052% | 27% |
| 1998-2025 | 163% | 49% |
Source: National Securities Depository Limited
1.13 India’s Resilience Profile
India is a moderately resilient economy — neither fragile nor robust — whose two resilience dimensions have moved in different directions during the study period.
On nurtured resilience, the picture is mixed rather than uniformly positive. Exchange-rate volatility has declined and is converging toward the stability of more advanced Asian economies, and post-pandemic fiscal consolidation is underway, albeit slowly. Inflation has moderated from near-double-digit levels to a 4–5% range. India’s disinflation coincided with a period of relatively benign global commodity prices, suggesting that global conditions may have contributed materially alongside improvements in monetary policy credibility.
FDI as a share of GDP has declined since 2011 rather than stabilised, which weakens rather than supports a stabilization narrative and reinforces the broader argument about India’s incomplete structural transformation.
On inherent resilience, the structural position remains a source of persistent vulnerability. India’s energy import dependence has deepened from 15.5% in the 1990s to nearly 37% today. Gold import dependence has followed a related but distinct trajectory, documented in Chart 8 – it rose from 0.30% of GDP in 1991–1998 to a peak of 2.16% in 2008–2011.
In the same era (2008-11) oil-driven pressure on the trade deficit was also at its highest — before settling at 1.20–1.37% of GDP across 2019–2024. India’s export concentration index has fluctuated rather than trended downward. Its current account deficit is chronic — 30 deficits in 35 years.
India’s external vulnerability stems from a simple, persistent problem. India’s merchandise imports much more than its exports. This trade gap is driven largely by must-have imports like crude oil, gold, and increasingly food items whose prices and volumes are subject to global swings beyond India’s control. The services sector, particularly IT exports and remittances from abroad, does help narrow this gap, but are subject to global economic cycles and now to deployment of AI in the IT services business.
This difficult convergence—a widening trade deficit, a low stability services and transfers buffer, and volatile flow of foreign financial capital can take away India’s financial safety net when we need it the most.
PART 2: RBI’s Management in Foreign Exchange Market
A country that runs a persistent current account deficit must attract capital account surpluses to fund it. During a period of relative calm this is manageable as capital flows are often stable, the exchange rate too is stable, and the RBI can accumulate reserves while keeping monetary conditions broadly accommodated.
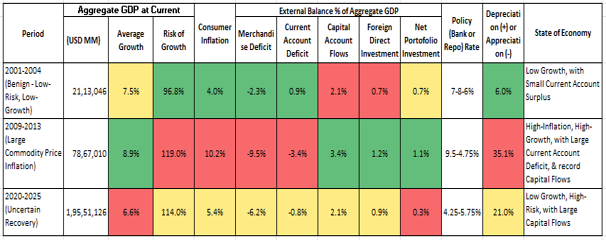
During periods of global economic stress, however, any deterioration in the current account or shift in investor sentiment triggers a sharp correction in rupee value, as the currency moves toward its fair value determined by inflation differentials with the US (Table 16). That correction is not cost-free. A depreciating rupee immediately raises the domestic price of imported goods, most consequentially crude oil, which feeds through into transport, manufacturing input costs, and retail food prices which generates imported inflation that the RBI is then compelled to address through monetary tightening.
Table 16: India’s External Performance during the periods of Calm and Turbulence
Source: Database on Indian Economy, RBI
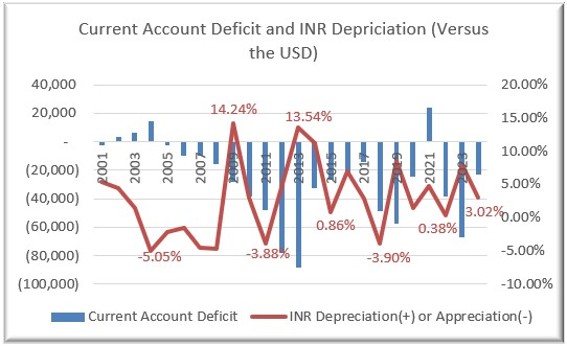
Chart 8 indicates that exchange-rate risk remains material because movements in the rupee are closely associated with changes in India’s external balance. Periods of wider current account or trade deficits coincide with greater depreciation pressure, while volatile portfolio flows can intensify short-run currency movements. The chart, therefore, suggests that India’s exchange rate remains exposed to external financing conditions, even when foreign-exchange reserves limit the immediate impact of shocks.
Chart 8: Current Account Deficit and INR Depreciation
Source: Database on Indian Economy, RBI
India’s historical record establishes a consistent and difficult sequence. The current account deficit widens first, driven by oil prices and/or gold import surges, the rupee adjusts later as capital flows respond, and the adjustment is rarely orderly. This is not a coincidence of timing, it is a structural transmission mechanism in which trade imbalances convert directly into currency pressure, bypassing any monetary circuit breaker the RBI might deploy. India’s exchange rate functions not as a managed anchor for stability, but as a shock absorber for underlying trade imbalances.
Table 17: RBI’s Market Interventions
| Period | RBI’s Market Participation (USD Million) | USD: INR Exchange Rate | ||||||
| Purchase | Sales | Purchase & Sales Volume | Incremental Forward Sale (+) or Purchase (-) | Increase in Reserves | Simple Average | Depreciation (+) or Appreciation (-) | INR Volatility | |
| 1991-1998 | 29,888 | 18,606 | 48,493 | 1,792 | 11,282 | 30.24 | 51.86% | 13.68% |
| 1998-2001 | 81,025 | 73,579 | 154,604 | -533 | 7,447 | 42.06 | 8.59% | 5.33% |
| 2001-2008 | 262,027 | 74,765 | 336,792 | -15,994 | 187,262 | 45.30 | -15.58% | 5.18% |
| 2008-2011 | 33,023 | 68,890 | 101,913 | 14,735 | -35,867 | 44.81 | -0.94% | 9.17% |
| 2011-2019 | 420,766 | 346,586 | 767,352 | 13,774 | 74,180 | 59.61 | 45.91% | 5.68% |
| 2019-2023 | 535,729 | 430,521 | 966,250 | -37,374 | 105,208 | 73.98 | 13.35% | 3.40% |
| 2023-2026 | 739,195 | 800,615 | 1,539,810 | 126,590 | -61,420 | 82.58 | 2.16% | 0.61% |
Source: Database on Indian Economy, RBI
Table 17 shows RBI’s spot-market purchase and sale volume reached USD 1,539,810 million during the period of 2023-2026 which is 50% more than 2019-2023 figure and double the entire 2011–2019 period. Sales (800,615) now exceed purchases (739,195) show that how RBI is defending rupees in open market.
RBI’s forward position for current era is USD 126,590 million, which is the largest single-era shift in the table which shows that RBI has increasingly committed to selling dollars at a future date rather than defending the rupee through spot-market sales alone. Within this total book, USD 29 billion was scheduled to mature over a rolling three-month window (spanning June through August 2026), while an additional USD 51 billion was scheduled to mature within the year.
It is higher than is typical even among emerging market central banks known for large intervention. The reason behind using this instrument is that a forward sale defers the actual delivery of dollars to a future date, which means it does not immediately draw down RBI’s spot reserves the way an equivalent spot-market sale would. This makes the forward book attractive to lean against rupee depreciation without visibly depleting the headline reserve number. However, the forward sale will need to be supported with real increase in reserves sooner or later. FNCR (B) has been the easiest route for building reserves during this and the earlier crises.
Foreign Currency Non-Resident Bank FCNR(B) deposit scheme is designed to attract foreign-currency deposits from non-resident Indians into the Indian banking system without by the participating banks bearing any exchange rate risk on these deposits. When the RBI first introduced FCNR accounts, it operated as a cross-border foreign currency fixed deposit with strict interest rate caps.
Over time, particularly during macro crises, the RBI transformed it into an aggressive tool for foreign exchange management using dollar-rupee swap window within three to five years. Banks earn the deposit-taking spread without carrying the currency risk; RBI carries it instead, in exchange for a short-term capital inflow that supports the currency and reserves at the time it is raised.
Total flow of FCNR(B) deposit in 2026 round is USD 127.2 billion from July 31, till August 31. RBI had advanced the deadline dollar-rupee swap window from September 30 to August 31, following an unprecedented surge in inflows because leaving the window open for an additional month could have pumped an extra USD 20 billion to USD 30 billion worth of rupees into the economy. The massive liquidity overload has complicated the RBI’s fight against domestic inflation. Any additional flow will make it even more difficult for the RBI to manage the financial system.
Spot purchases or sales, FCNR (B) deposits and forward contracts have served the immediate purpose of resisting rupee depreciation, but each did so by shifting the associated exchange-rate risk onto RBI’s own balance sheet. Spot intervention draws down reserves directly, the forward book defers the same dollar commitment to a future maturity date, and FCNR-type deposits bring in foreign-currency liabilities while leaving the swap cost with RBI rather than the banks that raise them.
RBI can manage the symptoms. It cannot solve the problem of structural vulnerability The case for high-technology export development is therefore not simply a growth argument; it is a resilience argument. What monetary policy cannot do, export sophistication can: reduce oil-import sensitivity, generate sustained current account improvement, and build the productive capabilities that make an economy structurally resistant. The evidence for India’s capacity to pursue this path is examined below.
Part 3: High-tech Exports as the Structural Solution
The preceding analysis established that active foreign exchange management and fiscal consolidation, while necessary, are insufficient to address India’s structural external vulnerabilities.
India imports complexity, embodied in technology-intensive products and production systems, while also importing commodities characterised by high price volatility, such as crude oil, oilseeds and gold. Although India’s export basket has become more diversified, it remains less capability-intensive than those of the major manufacturing economies. The resulting asymmetry contributes to a structural trade imbalance that monetary and exchange-rate interventions can manage but cannot fundamentally resolve.
Persistent current account deficits can be reduced in three ways: lower import dependence, higher commodity exports, or greater exports of complex, high-value products and services. For a rapidly growing and energy- and gold-import dependent economy such as India, the third pathway is the most sustainable. The question, therefore, becomes whether India possesses the capability base necessary to expand such exports.
The fundamental shift required is an upgrade of India’s export basket toward high-technology and high domestic value-added products that generate persistent surpluses. High-complexity technology exports which are defined as products with significant R&D intensity including aerospace, electronics, pharmaceuticals, scientific instruments, and advanced machinery which serve as the most direct measure of whether this structural transformation is underway.
3.1 High-Technology Exports — Scale and Comparative Position
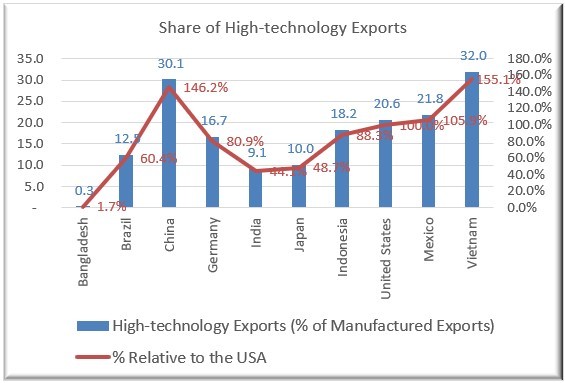
The comparative data place India’s position in stark perspective. India’s 9.1% high-tech share of manufactured exports compares with China’s 30.1%, Japan’s 10%, and the USA’s 20.6% and India trails even Vietnam (32%), a much smaller economy that has used assembly-led integration to rapidly upgrade its export basket. This is the quantitative expression of ‘scale without resilience’.
Chart 9: Share of High-Technology Exports (% of Manufactured Exports), 2007–2024
Source: World Development Indicators, World Bank
India exports large volumes but captures limited knowledge-intensive value. Three structural reasons explain why this gap directly determines resilience quality. First, high-tech exports are price-inelastic and far less vulnerable to commodity-price swings which directly reduce the sensitivity of the current account to oil cycles that was identified as the primary vulnerability. Second, they generate higher domestic value addition, improving export revenue per unit. Third, they reflect integration into global value chains at the design and engineering stage, generating technology spillovers and supplier development that reinforce the industrial base.
3.2 High-Technology Export Sectors
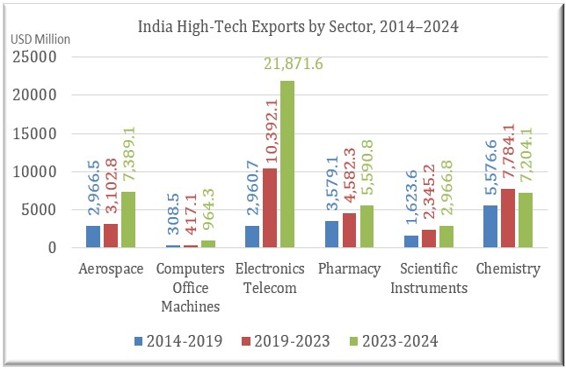
The sectoral breakdown (Chart 10 below) reveals a critical distinction that headline growth figures obscure. Pharmaceutical export growth represents capability-anchored resilience. High domestic value addition, strong IP barriers, and resistance to competitive displacement. Electronics growth, by contrast, must be disaggregated if it is concentrated in telephone assembly, as is currently the case with Apple’s supply chain in India. It represents a fragile assembly-led strategy that remains mobile and sensitive to labour cost shifts or trade policy changes. Resilience-building potential is not uniform across high-tech exports; policy must explicitly distinguish between assembly (low resilience contribution) and complex sub-system manufacturing (high resilience contribution).
Chart 10: India High-Tech Exports by Sector (USD Million), 2014–2024
Source: UN Comtrade
3.3 High-Technology Export Destinations
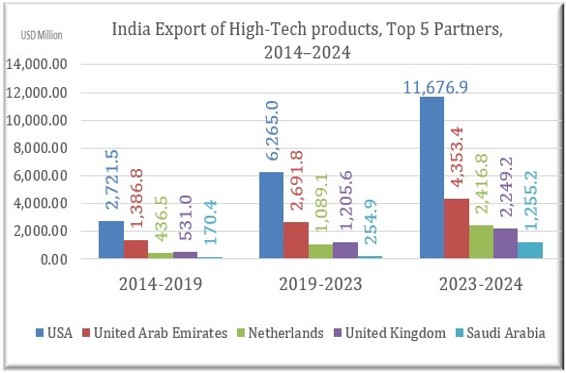
The sectoral vulnerability identified above is compounded by a second structural risk. Geographic concentration of India’s high-tech exports in a single dominant market. The United States is by far the largest destination for India’s high‑tech exports among the top five partners (Chart 11). In 2014–2019, US exports were about 2 times the second‑largest partner (UAE). By 2019–2023, this ratio rose to 2.3 times, and in 2023–2024 it widened to 2.7 times. The other top partners have also grown, but none has closed the gap with the US.
Chart 11: India Exports of High-Tech Products — Top 5 Partners, 2014–2024
Source: UN Comtrade
This pattern implies that geographic diversification of high‑tech exports has not occurred; instead, dependence on the US market has increased. Such concentration means that a single regulatory action or trade policy shift could impact India’s most dynamic export sectors.
The RBI cannot, in a meaningful way, alter the composition of exports or reduce oil and gold import dependence through exchange-rate intervention or reserve management. High-technology exports such as pharmaceuticals and automotive components address the root cause directly. Competitive position in this regime rests on accumulated firm capabilities, regulatory expertise, supplier network depth, and established buyer relationships, all of which are slow to build and slow to displace (Pranav, 2026). They are intrinsically less vulnerable to commodity-price shocks, generate higher domestic value addition, improve the current account sustainably, and build technological capabilities that create self-reinforcing growth dynamics. The question is whether India possesses the capability to scale this pathway.
Part 4: Does India Have the Capability to Manufacture High-Tech Goods?
The previous section established the structural case for high-technology export development as India’s pathway to resilience. This section evaluates whether India possesses the innovation inputs, manufacturing base, and economic complexity positioning required to pursue that pathway.
Our analysis covers the following two areas in this section:
- Capability inputs – the R&D, patent, design, and technology readiness infrastructure that determines the potential for high-technology production;
- Capability conversion – whether those inputs are being translated into sophisticated, manufactured output; and
In Part 5, we work with economic complexity framework to assess India’s structural position and the product areas it could possibly focus on.
Capability Inputs — Innovation Infrastructure
4.1 R&D Expenditure: The Primary Constraint
R&D investment is one of the most important inputs, among several required, to move from an assembly-integration model toward a capability-anchored model. India has not been investing adequately.
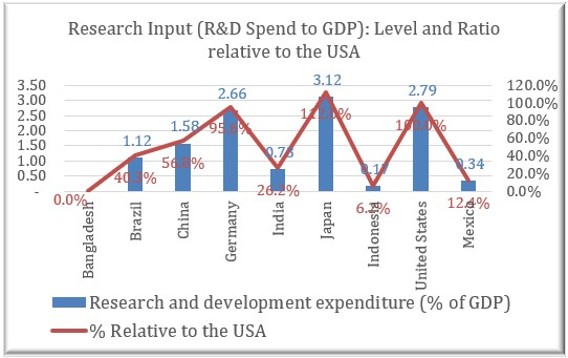
The “ratio relative to USA” series (Chart 12) is constructed as each country’s R&D expenditure (% of GDP) divided by the United States’ R&D expenditure (% of GDP) in the same year, expressed as a percentage. India’s R&D intensity relative to the US is the lower than Brazil, which is largely a commodity-led exporter economy.
Chart 12: R&D Expenditure (% of GDP) – Level and Ratio Relative to USA
Source: World Development Indicators, World Bank
India’s R&D intensity, below 1% of GDP, is low in absolute terms (well below the United States’ 2.79%, Germany’s 2.66%, Japan’s 3.12%, and China’s 1.58%.
4.2 Industrial Designs: The Product Innovation Gap
The R&D deficit identified above does not remain confined to research laboratories, it propagates downstream into the product innovation pipeline. Industrial design applications are the most direct measure of this propagation.
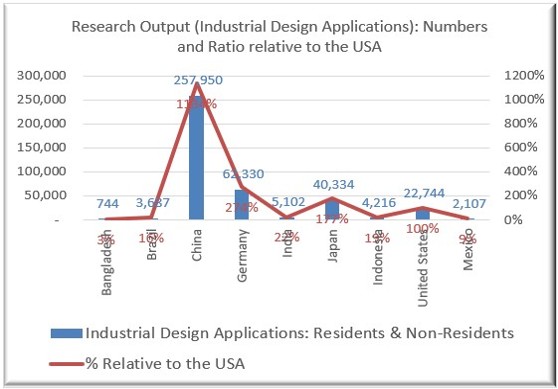
Chart 13: Industrial Design Applications — Numbers and Ratio Relative to USA
Source: World Development Indicators, World Bank
India’s industrial design application rate of roughly 22% of the US baseline, which reflects the limited depth of product-level innovation activity in its industrial sector. China files industrial design applications at 11 times of the US rate, reflecting a systematic, policy-driven approach to product differentiation across the manufacturing sector. Industrial designs are particularly relevant for high-technology consumer goods, scientific instruments, and precision manufacturing — precisely the sectors where India’s opportunity map (Section 5.2) identifies the greatest complexity-building potential. The design gap is a downstream consequence of the R&D underinvestment identified above.
4.3 Patent and Trademark Applications: Technical Innovation vs Commercial Branding
A trademark protects a brand name, logo, or product identity whereas a patent protects a technical invention. Patent activity serves as one of the most reliable indicators of deep technical capability capturing investments in new processes, novel compounds, and engineering innovations that form the productive foundation of high-technology manufacturing.
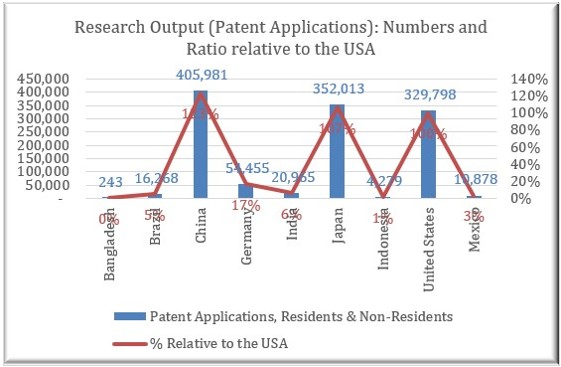
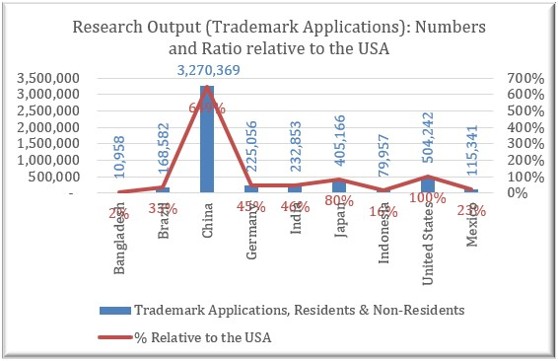
Chart 14 shows that India’s patent applications, at approximately 6% of the United States baseline, reveal a significant gap in this dimension relative to both advanced economies and China, whose filings now exceed the US level entirely.
Chart 14: Patent Applications — Numbers and Ratio Relative to USA
Source: World Development Indicators, World Bank
Chart 15 reveals India’s trademark activity which stands at 46% of the US level nearly eight times higher in relative terms as compared to patent activity. It tells that Indian firms are good at selling and marketing things but not yet at inventing and engineering things.
Chart 15: Trademark Applications — Numbers and Ratio Relative to USA
Source: World Development Indicators, World Bank
4.4 Human Capital
The skills-based innovation depends on R&D spending, patent activity, and industrial design filings, examined above, describe the intensity of formal innovation effort. Human capital — the skills, education, and health that determine whether an economy can absorb, adapt, and eventually generate frontier technology in the first place.
Table 18: Human Capital Index (across Countries), 1991-2023
| Country | Human Capital Index | |||||
| 1991-1998 | 1998-2000 | 2000-2008 | 2008-2011 | 2011-2019 | 2019-2023 | |
| Bangladesh | 1.54 | 1.62 | 1.73 | 1.86 | 2.00 | 2.11 |
| Brazil | 1.85 | 2.01 | 2.21 | 2.46 | 2.82 | 3.23 |
| China | 2.12 | 2.28 | 2.37 | 2.44 | 2.59 | 2.73 |
| Germany | 3.49 | 3.55 | 3.60 | 3.65 | 3.67 | 3.69 |
| Indonesia | 2.02 | 2.15 | 2.28 | 2.40 | 2.34 | 2.30 |
| India | 1.60 | 1.75 | 1.85 | 1.95 | 2.08 | 2.21 |
| Japan | 3.25 | 3.33 | 3.41 | 3.49 | 3.55 | 3.62 |
| Mexico | 2.29 | 2.39 | 2.50 | 2.59 | 2.70 | 2.82 |
| United States | 3.51 | 3.57 | 3.62 | 3.69 | 3.73 | 3.78 |
| Viet Nam | 1.81 | 1.94 | 2.14 | 2.39 | 2.53 | 2.67 |
Source: Penn World Table (PWT), Groningen Growth and Development Centre (GGDC)
India’s Human Capital Index rose from approximately 1.60 in 1991–1998 to approximately 2.21 in 2019–2023, a steady but modest gain that leaves India below China (2.73), Brazil (3.23), and Indonesia (2.30), and far below the advanced-economy cluster of Germany, Japan, and the United States.
China’s markedly stronger patent and design performance is not explained by a correspondingly small HCI gap over India (2.73 versus 2.21). Meyer-Krahmer and Schmoch (2001) argue that effective innovation outcomes depend less on aggregate R&D inputs and more on the institutional frameworks that connect specialised human capital to industry through cooperative mechanisms
4.5 Frontier Technology Readiness Index: Pockets of Excellence, Systemic Gaps
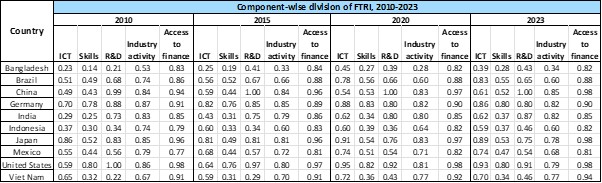
The Frontier Technology Readiness Index (FTRI) helps assess a country’s preparedness to use, adopt and adapt frontier technologies. It combines data on ICT deployment, skills, R&D activity, industrial capacity, and access to finance to provide a comprehensive measure of a country’s readiness. It is particularly useful for developing countries as it helps identify specific capability gaps and guides the formulation of a strategy and pathways to development. It also aids in the assessment of national AI capacities across leverage points of infrastructure, data, and skills, and helps pinpoint areas of action to strengthen the innovation system.
India’s overall technology readiness score as shown in Table 22, rose from 0.61 in 2010 to 0.74 in 2023. It shows improvement, but it is still behind China (0.79 to 0.84) and far behind the United States (1.0) and Germany (0.93) as of 2023.
Table 19: Frontier Technology Readiness Index (FTRI), 2022 and 2023
| Country | Frontier Technology Readiness Index, 2010-2023 | |||||||||||||
| 2010 | 2011 | 2012 | 2013 | 2014 | 2015 | 2016 | 2017 | 2018 | 2019 | 2020 | 2021 | 2022 | 2023 | |
| Bangladesh | 0.34 | 0.37 | 0.36 | 0.31 | 0.30 | 0.31 | 0.42 | 0.35 | 0.42 | 0.41 | 0.37 | 0.34 | 0.36 | 0.37 |
| Brazil | 0.70 | 0.72 | 0.73 | 0.71 | 0.69 | 0.70 | 0.76 | 0.67 | 0.71 | 0.72 | 0.72 | 0.72 | 0.74 | 0.74 |
| China | 0.79 | 0.81 | 0.87 | 0.84 | 0.82 | 0.83 | 0.91 | 0.80 | 0.84 | 0.83 | 0.79 | 0.77 | 0.79 | 0.84 |
| Germany | 0.93 | 0.98 | 1.00 | 1.00 | 0.97 | 0.96 | 0.95 | 0.95 | 0.95 | 0.94 | 0.92 | 0.91 | 0.92 | 0.93 |
| India | 0.61 | 0.67 | 0.69 | 0.68 | 0.64 | 0.65 | 0.68 | 0.61 | 0.67 | 0.68 | 0.68 | 0.67 | 0.71 | 0.74 |
| Indonesia | 0.50 | 0.50 | 0.52 | 0.49 | 0.42 | 0.50 | 0.57 | 0.51 | 0.56 | 0.55 | 0.52 | 0.54 | 0.54 | 0.53 |
| Japan | 0.89 | 0.89 | 0.90 | 0.90 | 0.87 | 0.86 | 0.87 | 0.87 | 0.87 | 0.88 | 0.86 | 0.85 | 0.87 | 0.84 |
| Mexico | 0.64 | 0.71 | 0.64 | 0.65 | 0.65 | 0.65 | 0.69 | 0.66 | 0.66 | 0.66 | 0.66 | 0.63 | 0.64 | 0.63 |
| United States | 0.96 | 0.96 | 0.97 | 0.99 | 0.97 | 0.96 | 1.00 | 1.00 | 1.00 | 1.00 | 1.00 | 1.00 | 1.00 | 1.00 |
| Viet Nam | 0.55 | 0.57 | 0.58 | 0.55 | 0.48 | 0.49 | 0.61 | 0.55 | 0.61 | 0.59 | 0.62 | 0.65 | 0.61 | 0.60 |
Source: United Nations Conference on Trade and Development
Table 20: Components of Frontier Technology Readiness Index, 2010-2023
Source: United Nations Conference on Trade and Development
Table 23 shows that India’s ICT score climbed the fastest of all its components, from 0.29 in 2010 to 0.62 in 2023, more than doubling. Its R&D score also rose quickly at first, from 0.73 to 0.87. But the lowest component i.e., skills haven’t moved much and stayed almost flat with no real improvement and the same applies for industry activity and access to finance.
While skill is not the only component that distinguishes advanced from developing economies, it remains the most important factor. Other components, particularly ICT, also lag in many emerging economies, but Brazil serves as a notable exception. Its ICT score (0.83) nearly matches that of advanced economies, yet its skills (0.55) still fall short of the advanced‑economy range. This suggests that ICT can be improved more readily through infrastructure and policy, whereas skills develop slowly and require sustained long‑term investment.
Despite India’s R&D (0.87) and industry activity (0.82) comparable to advanced peers, its low skill (0.37) prevents these strengths from spreading across the broader economy. Thus, skill is the deepest, oldest, and most consequential gap, even though ICT and access to finance also matter for a complete picture.
The significance of these findings extends beyond current technological performance. Measures such as FTRI provide an indication of an economy’s ability to participate in emerging technological domains, absorb new technologies and develop future productive capabilities. In this sense, they offer insight into an economy’s readiness to exploit future opportunities. This distinction between opportunity and readiness becomes particularly important in the discussion of Economic Complexity in Section 5, where India’s future diversification opportunities are examined through the Complexity Outlook Index.
Capability Conversion — From Innovation to Production
The transition from innovation inputs to manufactured output is where capability potential either converts into structural resilience or remains unrealised. Manufacturing value added as a share of GDP measures the scale of this conversion; the medium and high-technology share within it measures its quality.
4.6 Manufacturing Value Added: Scale and Sophistication
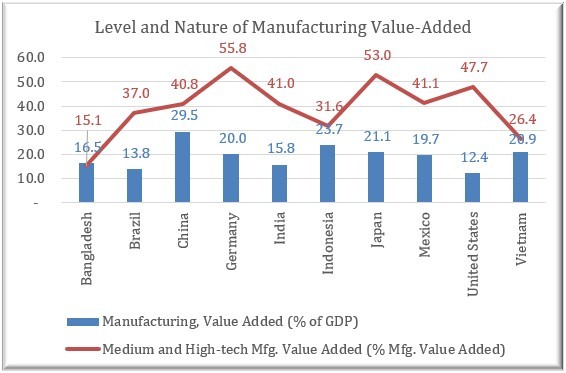
Chart 16 below shows both the size and the composition of manufacturing value added across the panel economies.
Chart 16: Level and Nature of Manufacturing Value Added, 1990-2022
Source: World Development Indicators, World Bank
China, Germany, and Japan have not only built large manufacturing bases, each accounting for 20–30% of GDP but have oriented them toward medium- and high-technology value addition, with medium/high-tech shares exceeding 50–55% of manufacturing value added.
India’s manufacturing base, at approximately 15.8% of GDP, is both smaller in absolute scale and skewed toward lower-value activities, with a medium/high-tech share of only 41%. This dual gap in scale and sophistication is directly traceable to the R&D underinvestment identified earlier. Without sustained investment in the process and product innovation capabilities that medium/high-tech manufacturing requires, the manufacturing base cannot shift upward in complexity.
4.7 Manufacturing Export Structure: The Complexity Gap in Trade
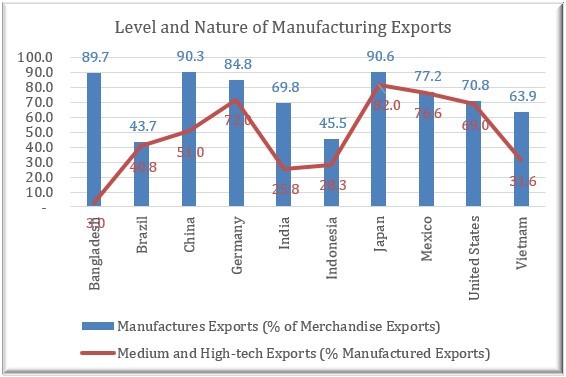
The domestic manufacturing composition, large in scale but limited in sophistication, translates directly into an export structure that mirrors its weaknesses. What India produces at home shapes what it can credibly sell abroad (Chart 17).
Chart 17: Level and Nature of Manufacturing Exports, 1990-2022
Source: World Development Indicators, World Bank
India’s export structure mirrors the domestic value-added picture: a moderately high share of manufactures in merchandise exports (69.8%), but a low share of medium and high-tech within those manufactures (25.8%).
Vietnam has achieved a high-tech export share of 31.6% through increased participation in global electronics value chains. India’s failure to achieve a comparable trajectory, despite its larger scale, more diverse industrial base, and stronger services capabilities, points to domestic policy and infrastructure deficits that constrain global value chain participation.
India’s Capability for High-Technology Manufacturing
Across every indicator examined whether it is R&D intensity, industrial design activity, patent filings, or human capital depth, India lags as compared to advanced economies or the emerging manufacturing powerhouses.
India’s manufacturing base is smaller in scale and weighted toward lower-value activity than other economies and has a comparatively low share of medium- and high-technology export. Although India had considerable technological potential, its capacity for high-technology manufacturing remains fundamentally constrained by persistent deficits in R&D investment, weak institutional channels for commercializing innovation, and a structural disconnect between its services-led excellence and the requirements of broad-based industrial upgrading.
Part 5: Economic Resilience through building greater Economic Complexity
Economic resilience is a function of a country’s productive capabilities and the opportunities that these capabilities create for exporting high value-adding products to other nations, particularly richer nations where consumers have ability and the willingness to pay for value.
Economic Complexity framework offers a useful lens through which to examine this issue. Developed by Ricardo Hausmann, César Hidalgo and their collaborators, the Economic Complexity approach focuses on the productive capabilities embodied in an economy and reflected in the goods it can competitively produce and export. The framework seeks to understand the accumulation of productive knowledge and the extent to which an economy possesses the capabilities required to participate in increasingly sophisticated forms of production.
Economies with broader and deeper productive capabilities are generally better positioned to diversify, enter new industries, shift resources in response to external shocks and sustain export growth over time. Economic complexity, therefore, is to be viewed not as a direct measure of resilience, but as an indicator of the productive foundations on which resilience can be built.
Two measures from the Economic Complexity literature are particularly relevant for this discussion. The first is the Economic Complexity Index (ECI), which provides an indication of the sophistication of an economy’s existing productive capabilities. The second is the Complexity Outlook Index (COI), which measures the extent of future diversification opportunities available to a country based on its current productive structure. Together, these measures offer insights into both a country’s current capability base and its future opportunity set.
5.1 Economic Complexity Index: India’s Position
A striking result emerges from data in Table 24. India’s ECI ranking (Table 24) suggests that it possesses a broad and increasingly sophisticated production base (improved ranking from 51 in 2015 to 41 in 2024) but remains below the economies that dominate advanced manufacturing, precision engineering and knowledge-intensive exports – the nations that are technology and manufacturing powerhouses.
An advanced economy like Japan or Germany houses significant productive capabilities and have utilised them too to become global manufacturing and export powerhouses. China too has leveraged its capability, and, therefore, its current opportunity set is smaller. Even though the current opportunity ranking for these nations is not high, they can, however, expand their opportunity set through greater investment in technology and creating products that leverage their newly developed technologies.
The evolution of firms and economies often follows a progression from assembly and contract manufacturing toward design, technology development and, ultimately, the generation of new scientific knowledge. Economic resilience is closely linked to where an economy is positioned along this continuum, since each stage expands the range of capabilities available for future diversification and upgrading. China’s rise to 10th position in ECI ranking reflects decades of deliberate structural transformation that converted low-complexity assembly into world-leading electronics and machinery exports and becoming a technology leader across sectors.
Table 21: Economic Complexity and Complexity Outlook Indices
| Country | ECI Score | ECI Rank /145 | COI Rank /145 | Three Major Goods Export | |||||
| Goods (top) | PCI | Goods (2nd) | PCI | Goods (3rd) | PCI | ||||
| Japan | 1.89 | 1 | 138 | Cars | 0.893 | Electronic integrated circuits | 1.562 | Machines | 1.015 |
| Germany | 1.38 | 6 | 122 | Cars | 0.893 | Medicaments, packed | 0.43 | Parts of Motor Vehicle | 0.839 |
| China | 1.26 | 10 | 94 | Computers | 1.026 | Transmission apparatus for radio, telephone, TV | 0.682 | Electronic integrated circuits | 1.562 |
| USA | 1.11 | 20 | 50 | Petroleum oils, refined | -1.2 | Serums and Vaccines | 1.277 | Computers | 1.026 |
| Mexico | 0.94 | 27 | 44 | Cars | 0.873 | Computers | 1.026 | Insulated electric wire | -0.282 |
| India | 0.72 | 41 | 2 | Petroleum oils, refined | -1.2 | Medicaments, packed | 0.43 | Transmission apparatus for radio, telephone, TV | 0.682 |
| Vietnam | 0.81 | 45 | 21 | Computers | 1.026 | Transmission apparatus for radio, telephone, TV | 0.682 | Electronic integrated circuits | 1.562 |
| Brazil | 0.27 | 56 | 18 | Petroleum oils, crude | -3.44 | Soya Beans | -2.56 | Iron ores and concentrates | -2.598 |
| Indonesia | 0.23 | 69 | 7 | Coal | -2.26 | Palm Oil | -2.84 | Ferroalloys | -0.902 |
| Bangladesh | 0.44 | 97 | 306 | T shirts | -0.98 | Men’s suits and pants | -0.98 | Sweaters, pullovers, knit | -0.973 |
Source: Atlas of Economic Complexity, Harvard Growth Lab
Chart 18: Ranking of countries based on ECI rank, 2012-2024
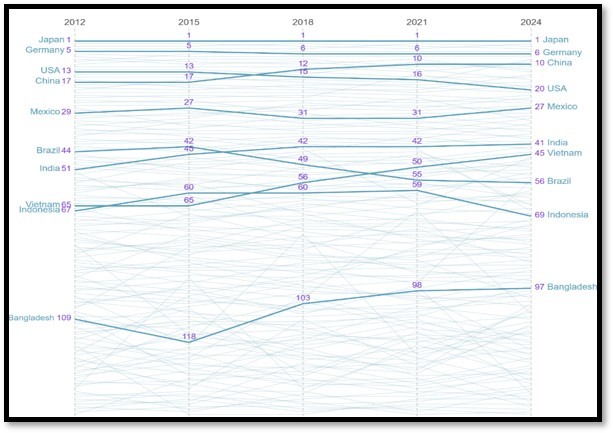
Source: Atlas of Economic Complexity, Harvard Growth Lab
India, on the other hand, has a unique challenge, with its capability score being inconsistent with its opportunity score. A large, diversified economy that exports a wide range of moderately complex goods across many categories without excelling in any single one.
High COI, however, suggests that India does not have to find new opportunities. It must leverage existing capabilities to realise opportunities available in adjacent space. If, however, the adjacent space is occupied with the existing manufacturing and export powerhouses, it must focus on building a narrowing range of specialised capabilities. Vietnam and Mexico have made significant progress by focusing on a narrower range of products – electronics and cars, respectively.
It brings us back to our earlier analysis that India has neither been investing adequately in R&D, industrial design skills and manufacturing capabilities across sectors nor in narrowly defined product groups like Mexico or Vietnam have done.
India’s focus on services could be one reason for the underinvestment, but it is potentially an advantage too, as automation levels increase in physical as well as digital products. The solution to India’s structural external vulnerability lies in greater value-adding complex products for exports through greater investment in manufacturing capabilities.
5.2 New Product Opportunity Analysis
India has missed previous technology waves, particularly LED lighting and solar photovoltaics. The energy storage revolution presents a near-term opportunity where India’s chemistry capabilities, battery-scale manufacturing potential, and domestic demand are aligned. Missing this wave would be a strategic failure of the first order.
The Atlas of Economic Complexity identifies specific high-value manufactured products that India could feasibly develop based on proximity in the product space, all sectors with high product complexity, strong global demand, and meaningful barriers to competitive displacement.
Table 22: New Product Opportunities for India
| Sector | Product Name |
| Manufacturing Deepening | Machine tools, Industrial & Agricultural Equipment, Advanced Materials, Specialty Chemicals, Precision instruments, Diagnostics, |
| Design and Innovation | Industrial Designs, Engineering Services, Product Development |
| Energy Transition | Batteries, Power Electronics, Grid Systems |
Source: Atlas of Economic Complexity, Harvard Growth Lab
5.3 General Purpose Technology Opportunities
General Purpose Technologies matter not simply because they drive growth, but because they create opportunities for capability accumulation and movement into more complex activities. Economies that successfully absorb GPTs are often able to expand the range and sophistication of products they produce and export. In the Indian context, the relevance of GPTs therefore lies in their potential contribution to capability conversion and export upgrading.
Beyond specific product opportunities, India’s path to high-technology export capability is intertwined with the application of general-purpose technologies (GPTs): artificial intelligence, robotics, genome editing, nanotechnology, 3D printing, IoT, blockchain, broadband, and solar photovoltaics. GPTs can be applied productively across a wide range of sectors, allowing India to leverage its software capabilities and engineering talent base across physical manufacturing domains.
Table 23: GPT Application Areas for Innovation and Value-Adding Solutions
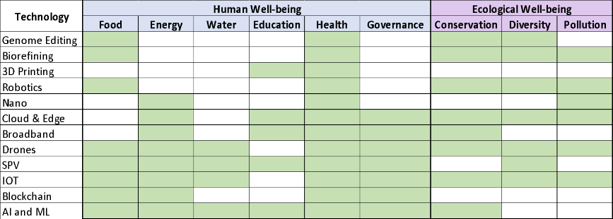
Table 24: GPT Application Areas for Production and Distribution Efficiency
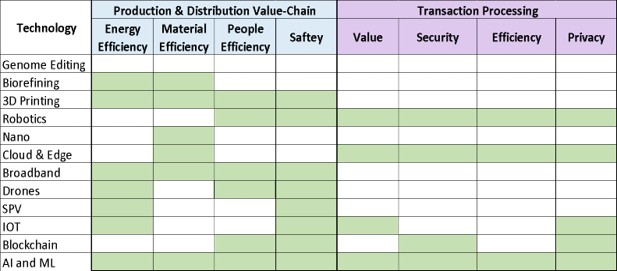
An Indian firm can additionally leverage the 5As framework — ensuring greater Availability, Affordability, Awareness, Ability, and Accessibility — to develop solutions that are globally relevant but adapted to emerging-market conditions.
Building Resilience through Capability-based Innovation
Economic resilience is often viewed through a macroeconomic lens and evaluated in terms of growth, inflation, exchange-rate stability, fiscal prudence or the adequacy of foreign exchange reserves. These indicators remain important and India has demonstrated progress across several of them over the last three decades. Yet resilience is ultimately tested not during periods of stability but in an economy’s ability to absorb and adapt to persistent external shocks.
The evidence presented in this paper suggests that India’s resilience is neither weak nor fully secure. The country benefits from a large domestic market, favourable demographics, a diversified economic structure, reasonably strong institutions in several areas of economic management, and a credible central bank. These strengths have enabled India to navigate successive global shocks more effectively than many emerging economies. At the same time, important structural vulnerabilities remain.
The most significant of these vulnerabilities arises from the interaction between energy dependence, trade imbalances and the composition of exports. India’s dependence on imported energy and gold creates a persistent demand for foreign exchange that grows with economic expansion. While capital inflows and reserve accumulation can help manage the resulting pressures, they do not eliminate the underlying structural imbalance. As a consequence, resilience cannot be viewed solely as a function of macroeconomic management. It must also be understood as a function of an economy’s ability to generate the exports required to finance its developmental ambitions.
This distinction helps explain the limits of a policy approach centred primarily on monetary management. The Reserve Bank of India has played a critical role in managing inflation, stabilising financial markets and mitigating external shocks. However, monetary policy can only address the consequences of structural imbalances. It cannot by itself create technological capabilities, deepen manufacturing ecosystems, strengthen innovation systems or transform the composition of exports. These are fundamentally capability-building challenges.
The analysis of innovation, manufacturing, export sophistication and economic complexity points to a common conclusion. India’s challenge is not the absence of economic opportunity. The country possesses a broad productive base and as indicated by its exceptionally strong Complexity Outlook Index, a large number of potential pathways into more sophisticated and higher-value economic activities. The principal challenge lies in converting these opportunities into realised productive capabilities through sustained investments in innovation, design, skills, advanced manufacturing, technology absorption and capability-enhancing forms of foreign investment.
Resilience is best understood not simply as the capacity to withstand shocks but as the capacity to continuously expand an economy’s productive capabilities. Countries that successfully deepen these capabilities are able to diversify exports, reduce external vulnerabilities, adapt to technological change and create new sources of growth. Countries that fail to do so remain dependent on favourable external conditions.
India has become increasingly effective at managing the consequences of external vulnerability; the more difficult task is reducing its structural causes through the accumulation of productive capabilities.
India’s long-term resilience will, therefore, be determined less by its ability to manage external pressures and more by its ability to transform productive opportunities into productive capabilities. The central economic challenge is not discovering what to do next. It is building the institutions, knowledge systems and industrial capacities required to do it.
Note: Generative AI tools were used in a developmental editing role during revision of this article. The authors remain responsible for all ideas, interpretations, examples, and final content.
References
- Briguglio, L. (1995). Small island developing states and their economic World Development, 23(9), 1615-1632.
- Hirschman, A. O. (1945). National power and the structure of foreign trade. University of California Press.
- United Nations Conference on Trade and Development (UNCTAD). (1995). Trade and development report, 1995. United Nations.
- Rashid, M., Sarin, V., & Esquivias, M. A. (2026). A multidimensional view of India’s export competitiveness using dynamic quadrant analysis of trade specialization. Research in Globalization, 12, Article 100366.
- Rajakaruna, I., & Suardi, S. (2021). The dynamic linkages between current account deficit and budget balance deficit in the South Asian region. Journal of Asian Economics, 77, 101393.
- International Monetary Fund. (2026). External sector report 2026: Amid rising imbalances, the case for rebalancing. International Monetary Fund.
- Meyer-Krahmer, F., & Schmoch, U. (1998). Science-based technologies: University-industry interactions in four fields. Research Policy, 27(8), 835-851.
[1] This paper extends Prof Anil K Sood’s research presented in paper titled Building Resilience and Accelerating Growth through Innovation to become an Upper Middle-Income Economy – Institute for Advanced Studies in Complex Choices. The paper has also benefited from Prof. Sood’s guidance in formulating the research problem and approach to analysis.